Author: Will Morgan
Decoding the 49ers' Offense
Analyzing defensive structure using StatsBomb's free tracking data
Evaluating the outcomes of passing plays from a QB perspective
Position-less Football: Receiver Alignment in the NFL
Representing Freeze Frames In Expected Completion Percentage Models
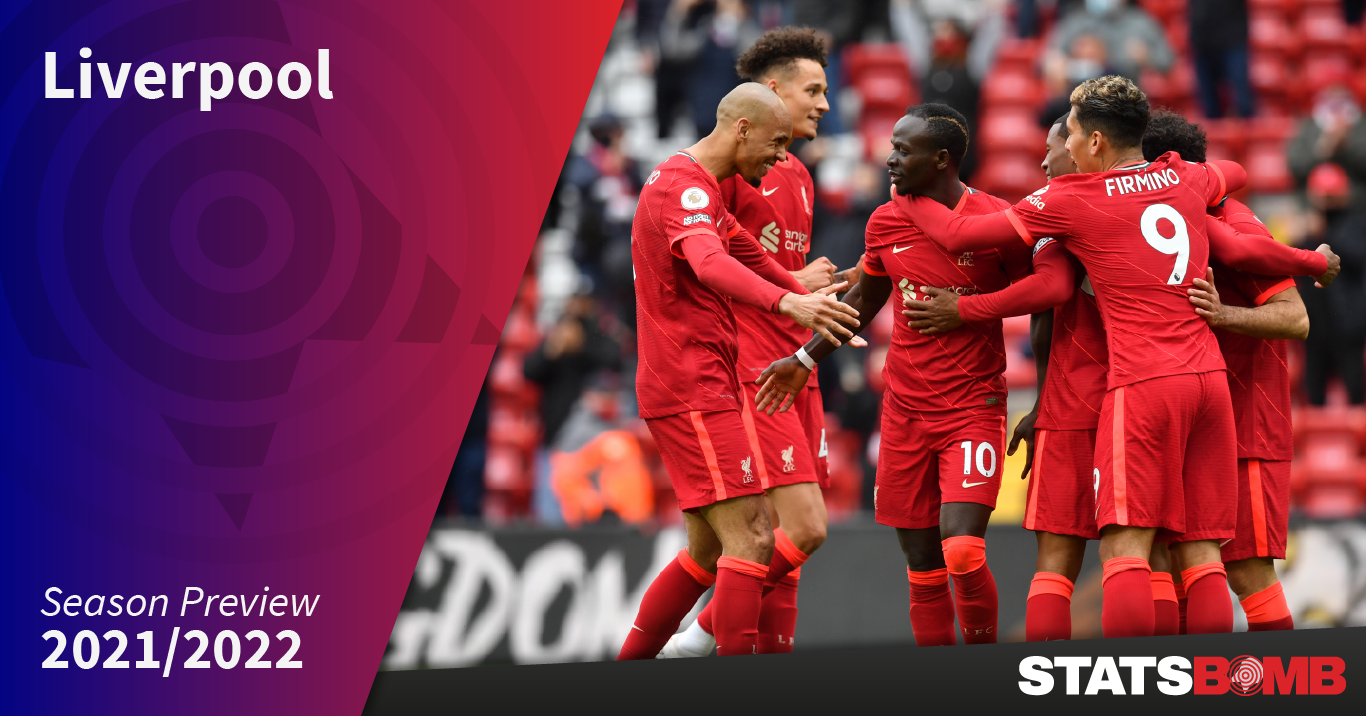
Liverpool: Season Preview 2021/22
After five seasons of relentless progress under Jürgen Klopp, culminating in that precious 19th title, Liverpool fell to their lowest points total since the first of his tenure. Third place and a Champions League quarter-final would generally be a perfectly acceptable season, but it represented a clear decline from 97 and 99 points in the prior two seasons, plus a sixth European Cup and World Club Cup trophy for good measure. The good news is that the route to that finish was unprecedented and circuitous, which promotes optimism for a new season and a rebound into domestic and European contention once more.
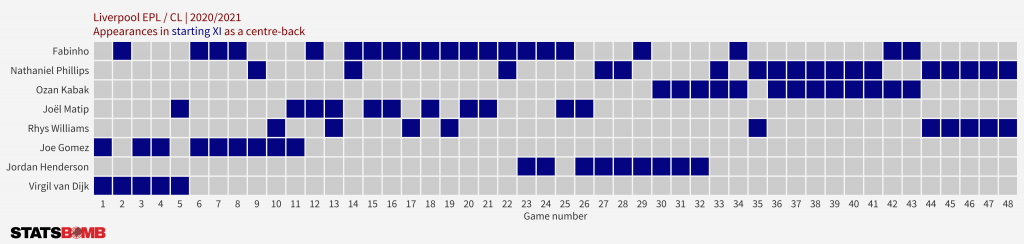
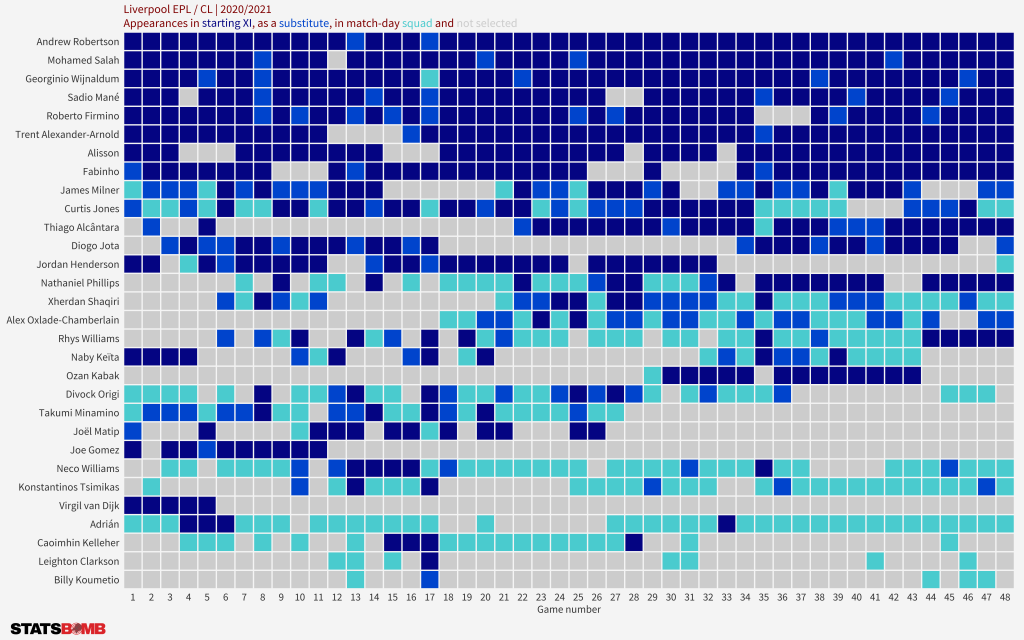
Until Alisson trotted forward in the 95th minute at the Hawthorns, the most memorable thing about Liverpool’s season was the injury crisis that plagued them through most of the season. The innocent days of September as Fabinho filled in alongside Virgil van Dijk at Stamford Bridge was in hindsight a clear example of first act foreshadowing.
Not only did they lose their defensive bedrock in van Dijk, they then proceeded to lose centre back after centre back as the season progressed (including the midfielders succonded to the backline). Jürgen Klopp filling in at the back was a mix of gallows humour and momentary consideration at one point. Throw in injuries in the midfield ranks to the mix and that 3rd place and European quarter-final takes on a different complexion.
For all the early-season injuries and absences, Liverpool actually found themselves top of the league as Santa rolled into town (for the third consecutive year). Nine wins, four draws and the solitary loss in the debacle at Villa Park put them four points clear of Leicester and eight clear of Manchester City (albeit having played a game more).
It took just a single month for their hard work to be undone.
Three points in five games saw them drop out of the top-four and fall seven points behind the eventual title winners. That wasn’t even the worst of it: a further run of six losses in seven games left them in eighth and seven points behind fourth place. Suddenly a team that had lost nine league games in three seasons had lost nine in 28 (and eight in the last 12). And still the roller-coaster ride wasn’t over, as 26 points in 10 games to finish the season sent them into third place and 69 points - a mediocre season overall compared to the prior two seasons but a decent achievement given the context.
Looking under the hood at Liverpool’s metrics over the course of the season, we can identify four phases:
- Weaker defence combined with stronger attack
- Improved defence, but with a weaker attack
- A worsening defence while the attack remained stable
- The attack lifts off to close the season
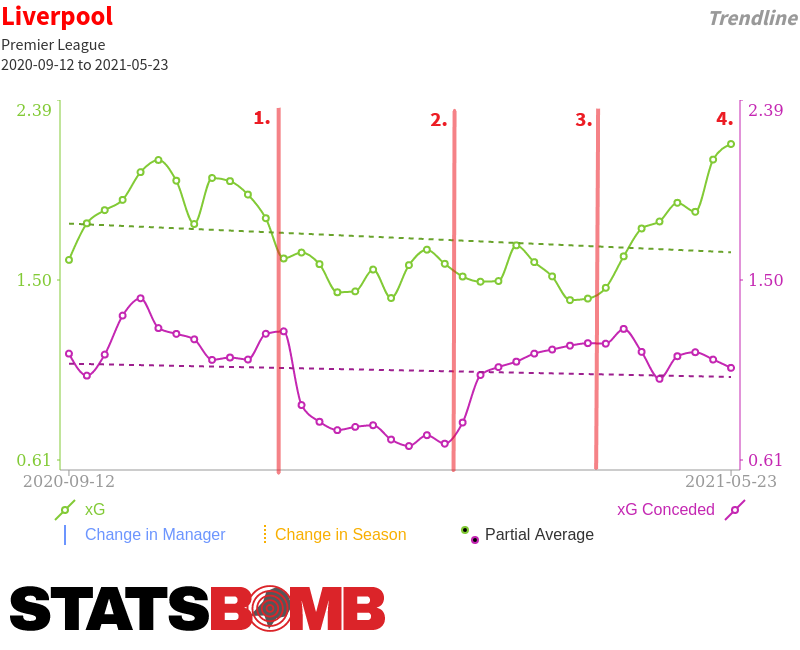
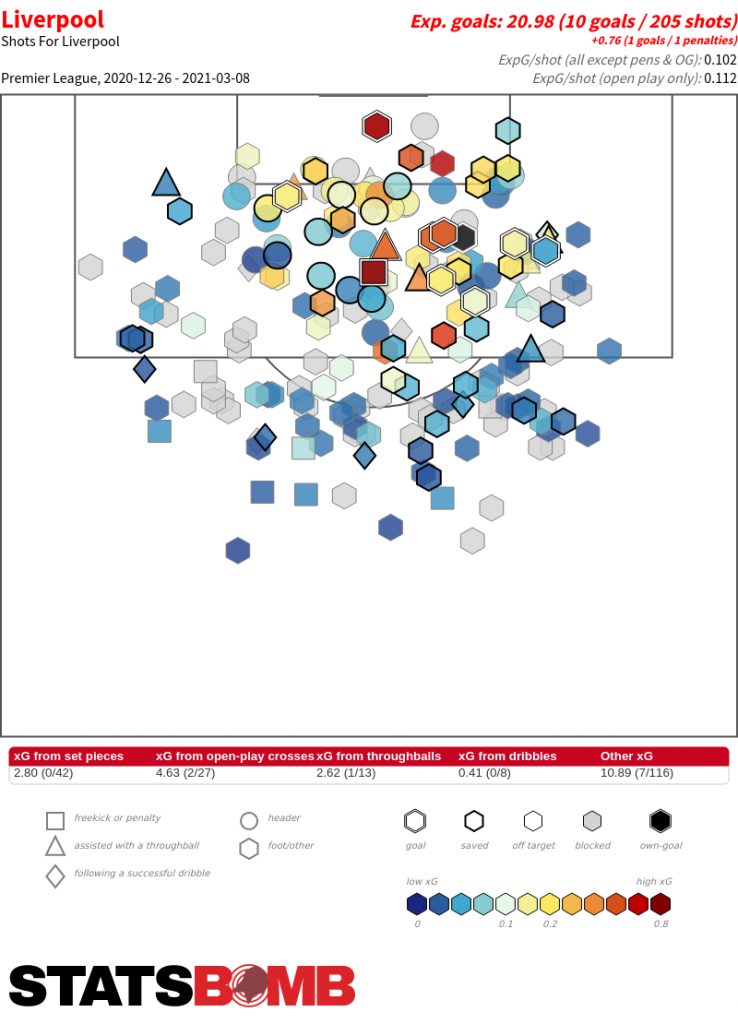
As much as injuries played a role in Liverpool’s season, the thing that truly cratered their season was a massive finishing slump after putting seven goals past Crystal Palace at Selhurst Park in December.
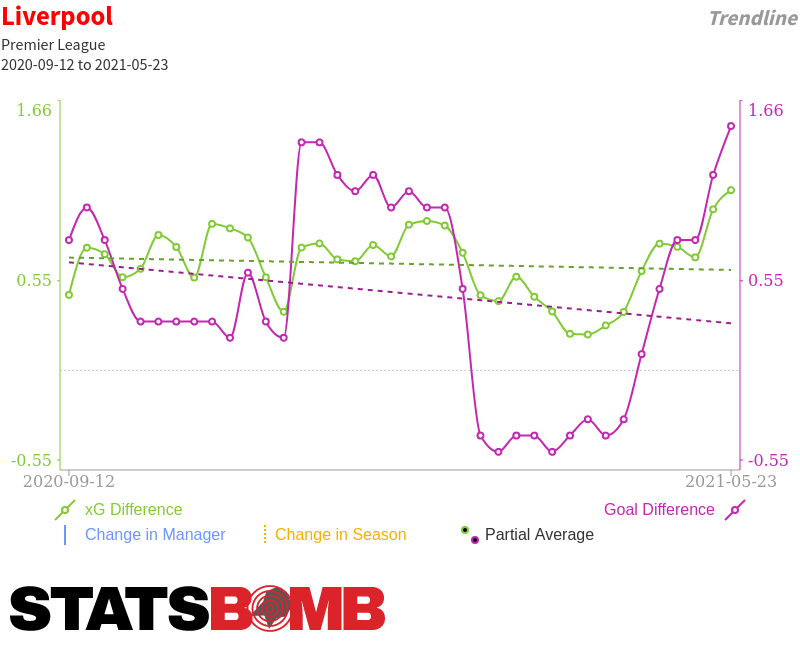
Overall, Liverpool’s metrics were strong, with the best non-penalty xG on the attacking end offsetting the fifth-best defensive record, equating to the second-best non-penalty xG difference over the season. From the perspective of xG, their numbers were remarkably similar to the title-winning season, although winning the league with seven games to spare plays a part here.
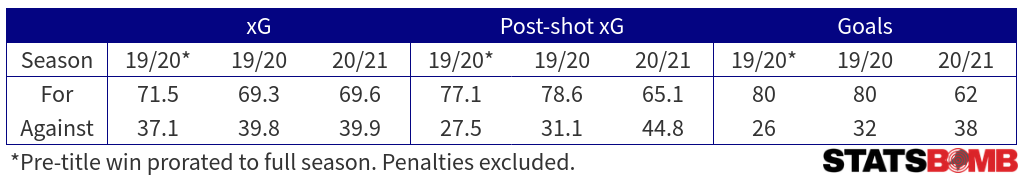
Aside from the goal-scoring skewing in the wrong direction, the biggest shift was in their post-shot xG; in 2019/20 the team was extremely proficient at challenging (and defeating) opposition goalkeepers, while also reducing the shot-stopping workload for Alisson and Adrian. Those positive skews reversed in 2020/21, and the aforementioned finishing slump exacerbated the issues on the attacking end. In old money, Liverpool’s shot-on-target differential declined from 115 in 2019/20 (+3.0 per game) to 64 in 2020/21 (+1.7 per game), despite an increase in their overall shot differential. This was a classic example of taking the rough with the smooth, albeit with the smooth ending a 30-year obsession with the title.
Dancing through midfield
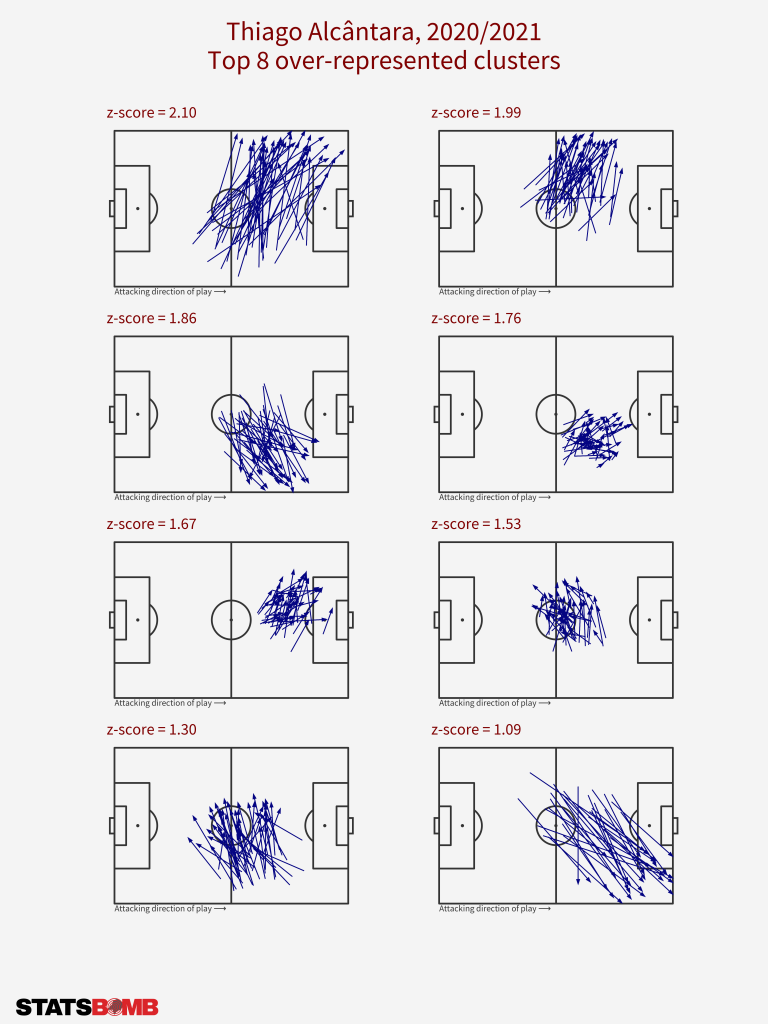
One question heading into last season was how the signing of Thiago would impact Liverpool’s play. While the midfield incumbents were certainly no slouches in possession, the primary playmaker played at right-back rather than in the midfield. After an injury-disrupted first-half of the season, Thiago himself grew into his role in the team and dovetailed nicely with Fabinho when the latter returned to midfield during the closing stages of the season.
As expected, he offered strong ball progression and chance creation from midfield, although the assists didn’t reflect his underlying numbers. An intriguing aspect of his passing was those cross-field passes from right-to-left, which are very much Trent’s music. To an extent, that ate into Trent’s passing profile, as while those diagonals were still his most distinctive pass-type, they weren’t quite as prevalent as prior seasons.
There was an added dimension to Liverpool’s midfield last season; a greater emphasis on ball-carrying, particularly from Curtis Jones and Thiago. Using our On-Ball Value (OBV) model, we can illustrate this in the maps below and also compare at the player-level; Wijnaldum’s OBV from carries almost doubled year-on-year, while Jones performed at similar levels to noted ball-carrier Naby Keïta.
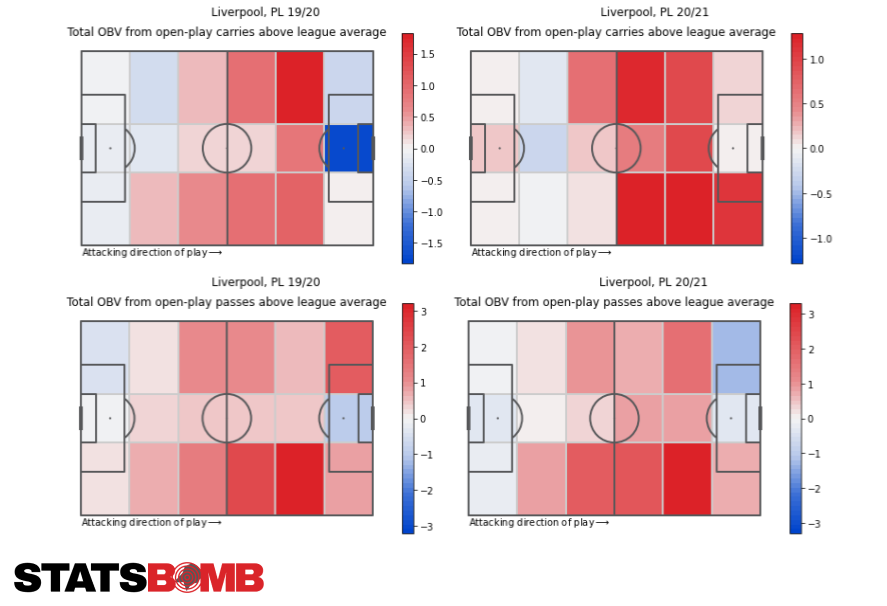
There was less emphasis on the full-backs in terms of xG assisted and OBV, particularly the left-hand side through Robertson. These tweaks resulted in broadly similar underlying metrics in the aggregate and, as with many trends over the past two years, it will be interesting to track how they evolve in a (hopefully) more normal season.
Fab-four?
For the first time since Philippe Coutinho’s departure, there are questions around the forward line of Mané, Firmino and Salah after Diogo Jota’s strong performances in his injury-hit debut campaign. The trio have essentially been ever-present when available, with Xherdan Shaqiri playing as part of a front-four in 2018/19 being the only real deviation from that template. Jota could supplant one of the incumbents, with Mané and Firmino being the most likely candidates according to the discourse. Alternatively, we could even see a new Liverpool-based fab-four emerge.
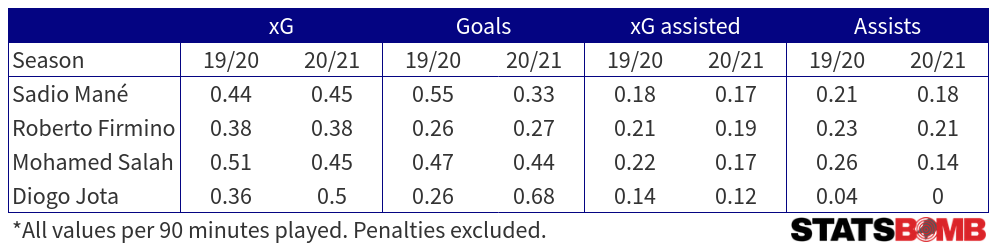
Examining the underlying process and outcomes, it’s clear that at least some of the whispers can be ascribed to the finishing streaks of said quartet. After consecutive seasons outpacing his xG, Mané came back down to earth in 2020/21, while Firmino continued a now three-season spell of undershooting his xG totals. Both had almost identical year-on-year underlying outputs in terms of xG and xG assisted though, and it’s safe to say that nobody was questioning their position while Liverpool cantered to a title.
On the other hand, Jota pulled out the neat trick of compounding strong underlying numbers with a hot finishing run after his own finishing woes in his final season at Wolves. Ironically, the one member of the quartet with fewer question marks from the commentariat was the one who showed a (slight) decline, although it’s hard to paint Salah’s numbers as anything but elite.
So, nothing to see here and we’re safe to file this as a nice problem to have?
Digging a little deeper through the prism of OBV paints a somewhat different picture regarding their performances, particularly in the case of Mané. His overall contribution declined sharply year-on-year, with his shooting accounting for ⅔ of the decline. The other major area of concern was his passing, as he moved from a net-positive contributor to a net-negative one; an increased number of turnovers and a decrease in his pass completion rate is symptomatic of this. Mané’s style of play can sometimes resemble something of a high-wire act – moments from something magical or maddening – and it seems he last season tipped more often towards the latter than the former.
While the above points towards some elements of concern, realistically Liverpool are in the enviable position of having four high-class, starting-calibre forwards with a complementary set of elite skills. Klopp even has the possibility of rotating the front-line without a significant reduction in quality, or tailoring the forward-line to certain situations and match-ups. Perhaps the natural order will shift over the course of the season, but the forward line provides both depth and quality at this point.
Transfers
From his assuredness on the ball and plug-and-playability across a number of roles, Gini Wijnaldum’s sheer robustness may well be the most keenly felt aspect of his departure. In the past two seasons, he was absent from one solitary EPL & CL squad, with 82 starts, ten substitute appearances and one match warming the bench. While the midfield options provide a good level of depth in terms of numbers and quality, several have had either long-term injuries or regular short-term absences over the past few seasons, so there is perhaps a degree of concern here.
Defensive reinforcements have arrived in 22-year old Ibrahima Konaté, who comes in from RB Leipzig. From a numbers perspective, perhaps the most eye-catching one is the shade under 2000 minutes he played in the Bundesliga & CL combined over the past two seasons, which is a quite magnificent trolling of the fanbase, it has to be said. He did, however, play close to a full season in 2018/19 as Leipzig finished with the Bundesliga’s best defensive record (and second-best by xG). He was generally in the squad last year but struggled for playing time in the second half of the season after returning from injury. Konaté profiles as an active front-foot defender, with Joël Matip being his closest parallel in the Liverpool squad, and like Matip he also enjoys carrying the ball forward.
Konaté displayed notable strength in the air on a high volume of duels in the Bundesliga, but how well this translates to the Premier League is a key question if he is to find playing time early in his Liverpool career (Ozan Kabak’s strong aerial win percentage certainly didn’t translate during his short spell on Merseyside.) Based on the types of high passes usually made in the respective leagues and by Liverpool and RB Leipzig’s opponents, we can observe distinctive traits:
- England tends to be biased towards crosses into the box and longer passes into the final third
- Germany generally sees shorter passes within the middle third of the pitch, and a much smaller emphasis on crosses into the box
Such traits point towards a somewhat different challenge. It’s likely a period of adaptation will be required.
Konaté’s passing range appears somewhat limited as he is heavily skewed towards short and/or sideways passes. The longer passes he does play tend to be lower percentage vertical ones down the line that tend not to feature in Liverpool’s centre back profile. Demonstrating the ability to play those progressive diagonal passes out towards the full-backs that are so favoured by the Liverpool backline would be a very encouraging sign.
Projection
With Manchester City as the firm favourites for the title, the bookies have Liverpool in the high-70s in terms of points, alongside Chelsea, which seems a reasonable median expectation (I’d probably go a bit higher, but red-tinted spectacles and everything). We saw the floor of that kind of range last season, and they still finished third and made a Champions League quarter-final. The path to stronger performances and both domestic and European contention is also clear: a more normal level of injuries, the best forward line in the league finishing their chances, and van Dijk returning from injury somewhere close to his previous performance levels.
Taking last season as an anomaly, Liverpool have consistently put themselves within striking distance of glory and, if a team is to challenge City, then the team that has averaged 88 points over the last three seasons seems the most probable candidate. But they’ll need to hit their ceiling once more.
Want to read about another team? The rest of our Premier League season previews can be found here
If you're a club, media or gambling entity and want to know more about what StatsBomb can do for you, please contact us at Sales@StatsBomb.com
We also provide education in this area, so if this taste of football analytics sparked interest, check out our Introduction to Football Analytics course
Follow us on Twitter in English and Spanish and also on LinkedIn
Using Pressure to Evaluate Centre Backs
Analysing centre backs is a subject likely to provoke either a shrug or a wistful smile from an analytics practitioner. To varying degrees, there are numbers and metrics aplenty for other positions but in public analytics at least, development has been limited and a genuine track record of successful application is yet to be found. If centre back analysis is the holy grail of public football analytics, then the search thus far has been more Monty Python than Indiana Jones.
One of the major issues with centre back analysis is that positioning isn't measured directly by on-ball event data and any casual football watcher can tell you that positioning is a huge part of the defensive art. Tracking data would be the ideal means to assess positioning but it comes at a high-cost both computationally and technically, while having a much smaller coverage in terms of leagues than simpler event data provision.
StatsBomb's new pressure event data serves as a bridge between the traditional on-ball event data and the detailed information provided by tracking data, offering a new prism to investigate the style and effectiveness of centre backs. While it won’t provide information on what a defender is up to when he is not in the immediate vicinity of the ball, it does provide extra information on how they go about their task.
Starting at the basic counting level, centre backs averaged six pressure actions per ninety minutes in the Premier League last season. Tackles and interceptions clock in at 0.8 and 1.3 per 90 respectively, which immediately illustrates that pressure provides a great deal more information to chew on when analysing more ‘proactive’ defending. I’m classing clearances and blocking shots as ‘reactive’ given they mostly take place in the penalty area and are more-directly driven by the opponent, while aerial duels are a slightly different aspect of defending that I’m going to ignore for the purposes of this analysis.
The figure below maps out where these defensive actions occur on the pitch and is split between left and right centre backs. Pressure actions typically occur in wider areas in the immediate vicinity of the penalty area, with another peak in pressure just inside the top corner of the 18-yard box. This suggests that centre backs don’t engage too high up the pitch in terms of pressure and are generally moving out towards the flanks to engage opponents in a dangerous position and either slow-down an attack, cut down an attackers options or directly contest possession.
The location of pressure actions is somewhat similar to the picture for interceptions, although the shape of the latter is less well-defined and tends to extend higher up the pitch. Tackles peak in the same zone just outside the top corners of the penalty area but are also less spatially distinct. Tackles also peak next to the edge of the pitch, a feature that is less distinct in the pressure and interception maps.
Partners in Crime
The number of pressure actions a centre back accumulates during a match will be driven by their own personal inclinations and role within the team, as well as the peculiarities of a given match and season e.g. the tactics of their own team and the opposition or the number of dangerous opportunities their opponent creates. The figure below explores this by plotting each individual centre back’s pressure actions per ninety minutes against their team name. The team axis is sorted by the average number of pressure actions the centre backs on each team make over the season.

At the top end of the scale, we see Arsenal and Chelsea, two teams that regularly played a back-three over the past season. Nacho Monreal and César Azpilicueta led the league in pressure actions per ninety minutes by a fair distance and it appears the additional cover provided by playing in a back-three and their natural instincts developed as full backs meant they were frequently putting their opponents under pressure. Manchester United top the list in terms of those predominantly playing with two centre backs, with all of their centre backs applying pressure at similar rates.
At the other end of the scale, Brighton and Leicester’s centre backs appear to favour staying at home in general. Both though are clear examples of there being an obvious split between the number of pressure actions by the primary centre backs on a team, with one being more aggressive while the other presumably holds their position and plays a covering role. This division of roles is perhaps most clearly demonstrated by Chelsea’s centre backs, with Azpilicueta and Antonio Rüdiger as the side centre backs being more proactive than their counter-part in the central defensive slot (Cahill or Christensen).
Liverpool’s improved defensive performance over the course of the season has been attributed to a range of factors, with the signing of Virgil Van Dijk for a world-record fee garnering much of the credit. Intriguingly, his addition to the Liverpool backline has seemingly offered a significant contrast to the club’s incumbents, who all favoured a slightly greater than average number of pressure actions. Furthermore, Van Dijk ranked towards the bottom of the list in terms of pressure actions for Southampton (4.5 per 90) as well, with his figure for Liverpool (3.7 per 90) representing a small absolute decline. As an aside, Van Dijk brings a lot to the table in terms of heading skills, where he ranks highly for both total and successful aerial duels, so he is still an active presence in this aspect, while being a low-event player in others.
Centre backs are often referred to as a partnership and the above illustrates how defensive units often setup to complement each others skill sets and attempt to become greater than the sum of their parts.
The Thompson Triangle
Mark Thompson has led the way in terms of public analytics work on centre backs and has advocated for stylistic-driven evaluations as the primary means of analysis, which can then be built on with more traditional scouting. Pressure actions add another string to this particular bow and the figure below contrasts the three proactive defensive actions discussed earlier. Players in different segments of the triangle are biased towards certain actions, with those in the corners being more strongly inclined towards one action over the other two.
There is a lot to pour over in the figure, so I’ll focus on defenders who are most inclined towards pressure actions. One clear theme is that such centre backs frequently featured on the sides of a back-three. Ryan Shawcross is unusual in this aspect given he was generally the middle centre back in Stoke’s back-three, as well as the right centre back in a back four. Ciaran Clark at Newcastle and Kevin Long at Burnley are the only players who featured mostly as one of two centre backs, with their partner adopting a more reserved role.
The additional cover provided by a back-three system and the frequent requirement for the player on the flanks to pull wide and cover in behind their wing-back seemingly plays a large part in determining the profile of centre backs. This illustrates the importance of considering team setup in determining a defenders profile and should feed into any recruitment process alongside their individual inclinations.
The analysis presented provides descriptive metrics and illustrations of the roles played by centre backs and is very much a first look at this new data. While we can't gain definitive information on positioning without constant tracking of a player, the pressure event data provides a new lens to evaluate centre backs and significantly increases the number of defensive actions that can be evaluated further. Armed with such information, these profiles can be built upon with further data-driven analysis and combined with video and in-person scouting to build a well-rounded profile on the potential fit of a player.
Now all we need is a shrubbery.
How StatsBomb Data Helps Measure Counter-Pressing
The concept of pressing has existed in football for decades but its profile has been increasingly raised over recent years due to its successful application by numerous teams. Jürgen Klopp and Pep Guardiola in particular have received acclaim across their careers, with pressing seen as a vital component of their success. There are numerous other recent examples, such as the rise of Atlético Madrid, Tottenham Hotspur and Napoli under Diego Simeone, Mauricio Pochettino and Maurizio Sarri respectively.
Alongside this rise, public analytics has sought to quantify pressing through various metrics. Perhaps the most notable and widely-used example was ‘passes per defensive action’ or PPDA, which was established by Colin Trainor and first came to prominence on this very website. Anecdotally, PPDA found its way inside clubs and serves as an example of public analytics penetrating the private confines of football. Various metrics have also examined pressing through the prism of ‘possessions’, which Michael Caley has put to effective use on numerous occasions. Over the past year, I sought to illustrate pressing by quantifying a team’s ability to disrupt pass completion. While this was built on some relatively complex numerical modelling, it did provide what I thought was a nice visual representation of the effectiveness of a team’s pressing.
While the above metrics and others have their merits, they tend to ignore that pressing can take several forms and are biased towards the outcome, rather than the actual process. The one public example that side-steps many of these problems is the incredible work by the Anfield Index team through their manual collection of Liverpool’s pressing over the past few seasons but this has understandably been limited to one team.
Step-forward the new pressure event data supplied by StatsBomb Services. This new data is an event that is triggered when a player is within a five-yard radius of an opponent in possession. The radius varies as errors by the opponent would prove more costly, with a maximum range of ten-yards that is usually associated with goalkeepers under pressure. As well as logging the players involved in the pressure event and its location, the duration of the event is also collected.
The data provides an opportunity to explore pressing in greater detail than ever before. Different teams use different triggers to instigate their press, which can now be isolated and quantified. Efficiency and success can be separated from the pressing process in a number of ways at both the team and player-level. Such tools can be used in team-evaluation, opposition scouting and player recruitment.
One such application of the new data is to explore gegenpressing or counter-pressing, which is the process where a team presses the opposition immediately after losing possession. The initial aim of counter-pressing is to disrupt the opponent’s counter-attack, which can be a significant danger during the transition phase from attack-to-defence when a team is more defensively-unstable. Ideally possession is quickly won back from the opponent, with some teams seeking to exploit such situations to attack quickly upon regaining possession. Five seconds is often used as a cut-off for the period where pressure on the opposition is most intensely applied during the counter-press.
The exciting new dimension provided by StatsBomb’s new pressure data is that the definition of counter-pressing you would find in a coaching manual can be directly drawn from the data i.e. a team applies pressure to their opponent following a change in possession. The frequency at which counter-pressing occurs can be quantified and then we can develop various metrics to examine the success or failure of this process. Furthermore, we can analyse counter-pressing at the player-level, which has been out-of-reach previously.
The figure below illustrates where on the pitch counter-pressing occurs based on data from 177 matches from the Premier League this past season. The pitch is split into six horizontal zones and is orientated so that the team out-of-possession is playing from left-to-right. The colouring on the pitch shows the proportion of open-play possessions starting in each zone where pressure is applied within five seconds of a new possession.
The figure illustrates that pressure is most commonly applied on possessions starting in the midfield zones, with marginally more pressure in the opposition half. Possessions beginning in the highest zone up the pitch come under less pressure, which is likely driven by the lower density of players in this zone on average. Very few possessions actually begin in the deepest zone and a smaller proportion of them come under pressure quickly than those in midfield.
From a tactical perspective, pressing is generally reserved for areas outside of a team’s own defensive third. The exact boundary will vary but for the following analysis, I have only considered possessions starting higher up the pitch, as denoted by the counter-pressing line in the previous figure.
In the figures below, the proportion of possessions in the counter-pressing zones where pressure is applied within five seconds is referred to as the ‘counter-pressing fraction’. In the sample of matches from the Premier League this season, a little under half (0.47) of open-play possessions come under pressure from their opponent within five seconds. At the top of the counter-pressing rankings, we see Manchester City, Tottenham Hotspur and Liverpool, which is unsurprising given the reputations of their managers. At the bottom end of the scale, we find a collection of teams that have mostly been overseen by British managers who are more-known for a deep-defensive line.
On the right-hand figure above, the strong association between counter-pressing and possession is illustrated, with the two showing a high correlation coefficient of 0.86 in this aggregated sample. Interpreting causality here is somewhat problematic given the likely circular relationship between the two parameters; teams that dominate possession may have more energy to press intensively, leading to a greater counter-pressing fraction, which would lead to them winning possession back more quickly, which will potentially increase their possession share and so on. The correlation is weaker for individual matches (0.36), which hints at some greater complexity and is something that can be returned to at a later date.
Perhaps the most interesting finding in the above figures is Burnley’s high counter-pressing fraction. The majority of analysis on Burnley has focused on their defensive structure within their own box and how that affects their defensive performance in relation to expected goals (xG). The figure illustrates that Burnley employ a relatively aggressive counter-press, especially in relation to their possession share.
Examining Burnley’s counter-pressing game in more detail reveals that they counter-press 18 possessions per game, which is above average and only slightly lower than Manchester City. However, they only actually regain possession within five seconds 2.5 times per game, which falls short of what you might expect on average and falls below their counter-pressing peers. In terms of the ratio between their counter-pressing regains and total counter-pressing possessions, they sit 17th on 14%.
Burnley’s counter-press is the fourth least-effective at limiting shots, with 13% of such possessions ending with them conceding a shot compared to the average rate of 10%. However, one thing in their favour is that these possessions are typically around the league average in terms of their length and speed of attack, which will allow Burnley to regain their vaunted defensive organisation prior to conceding such shots.
The more dominant discourse around pressing is as an attacking rather than defensive weapon, so narratives are often formed around teams that regularly win back the ball through pressing and use this to generate fast attacks e.g. Liverpool and Tottenham Hotspur. As a result, a team like Burnley who seemingly employ counter-pressing as a defence-first tactic to prevent counter-attacks and slow attacking progress may be overlooked.
Burnley’s manager, Sean Dyche, has typically been lumped-in with the tactical stylings of the perennially-employed British managers who aren’t generally associated with pressing tactics. Dyche was reportedly most impressed by the pressing game employed by Guardiola’s Barcelona and he has seemingly implemented some of these ideas at Burnley. He has instilled an approach that combines counter-pressing and a low-block with numbers behind the ball, which is a neat trick to pull-off; Diego Simeone and Atlético Madrid are perhaps the more apt comparison given such traits.
The above analysis illustrates the ability of StatsBomb’s new pressure event data to illuminate an important aspect of the modern game. Furthermore, it is able to do this in a manner that directly translates tactical principles, separating underlying process and outcome, which is a giant step-forward for analytics. It also led to an analysis discussing the similarity between Guardiola’s legendary Barcelona team and Sean Dyche’s Burnley, which was probably unexpected to say the least.
This is just a taster of what is possible with StatsBomb’s new data. There's more information in this presentation from the StatsBomb launch event and you can expect more analysis to appear over the summer and beyond.
Under Pressure
Models that attempt to measure passing ability have been around for several years, with Devin Pleuler's 2012 study being the first that I recall seeing publicly. More models have sprung up in the past year, including efforts by Paul Riley, Neil Charles and StatsBomb Services. These models aim to calculate the probability of a pass being completed using various inputs about the start and end location of the pass, the length of the pass, the angle of it, as well as whether it is played with the head or foot.
Most applications have analysed the outputs from such models from a player passing skill perspective but they can also be applied at the team level to glean insights. Passing is the primary means of constructing attacks, so perhaps examining how a defense disrupts passing could prove enlightening?
In the figure below, I've used a pass probability model (see end of post for details and code) to estimate the difficulty in completing a pass and then compared this to the actual passing outcomes at a team-level. This provides a global measure of how much a team disrupts their opponents passing. For 2016-17, we see the Premier League's main pressing teams with the greatest disruption, through to the barely corporeal form represented by Sunderland.
The next step is to break this down by pitch location, which is shown in the figure below where the pitch has been broken into five bands with pass completion disruption calculated for each. The teams are ordered from most-to-least disruptive.
We see Manchester City and Spurs disrupt their opponents passing across the entire pitch, with Spurs' disruption skewed somewhat higher. Liverpool dominate in the midfield zones but offer little disruption in their deepest-defensive zone, suggesting that once a team breaks through the press, they have time and/or space close to goal; a familiar refrain when discussing Liverpool's defense.
Chelsea offer an interesting contrast with the high-pressing teams, with their disruption gradually increasing as their opponents inch closer to their goal. What stands out is their defensive zone sees the greatest disruption (-2.8%), which illustrates that they are highly disruptive where it most counts.
The antithesis of Chelsea is Bournemouth who put together an average amount of disruption higher up the pitch but are extremely accommodating in their defensive zones (+4.5% in their deepest-defensive zone). Sunderland place their opponents under limited pressure in all zones aside from their deepest-defensive zone where they are fairly average in terms of disruption.
The above offers a glimpse of the defensive processes and outcomes at the team level, which can be used to improve performance or identify weaknesses to exploit. Folding such approaches into pre-game routines could quickly and easily supplement video scouting. ____________________________________________
Appendix: Pass probability model
For this post, I built two different passing models; the first used Logistic Regression and the second used Random Forests. The code for each model is available here and here.
Below is a comparison between the two, which compares expected success rates with actual success rates on out-of-sample test data.
The Random Forest method performs better than the Logistic Regression model, particularly for low probability passes. This result is confirmed when examining the Receiver Operating Characteristics (ROC) curves in the figure below. The Area Under the Curve (AUC) for the Random Forest model is 87%, while the Logistic Regression AUC is 81%.
Given the better performance of the Random Forest model, I used this in the analysis in the main article.
Liverpool 2017/18 Season Preview
Liverpool enter 2017-18 with aspirations of challenging for the title after an at times hugely promising and exciting first full season under Jürgen Klopp. The prospect of European adventures returning on Tuesday or Wednesday nights is tantalizingly close providing they negotiate their Champions League qualifying round.
The story so far
Liverpool's tally of 76 points last season was their joint-third best tally over the last decade and only their second top-four finish since the Benitez years. In fact, after a run of four top-four finishes, Liverpool haven't registered back-to-back Champions League qualifications since Rafa left and have on average finished just sixth during that time with 65 points on the board.
With the above in mind, it's tempting to view a season of consolidation as the priority for the coming season, alongside beginning to re-establish the team as a European force. Liverpool's underlying performance last season is encouraging, with their goal return reasonably in-line with expectation and their expected goal difference placing them well in contention for a title push.
Drilling further into their expected goal numbers, sees a team that experienced fluctuating under-lying performance over the course of the season with a significant decline once 2017 was rung in. The graphic below illustrates this alongside a longer-term outlook encompassing the past five seasons.
The heights of 2016/17 are close to those of the Suárez-powered team under Rodgers, while the low-point is more in-line with Klopp's early tenure at the club. The past season thus illustrated that the team was capable of title-contending performances at times but also switched to a team competing for the fourth-place trophy at best.
Upping the pace
Closer examination of the downturn in performance using my 'team strategy analysis' shows a drying up of a specific type of shot generation. High-quality chances born of fast-paced attacks from deep and after midfield-transitions declined.
Sadio Mané was evidently missed due to AFCON duties and injury over the latter half of the season and this is borne out by the numbers. According to my model, he was second best in the EPL (0.11 per 90) in terms of xG-contribution (the sum of expected goals and assists) from fast-paced attacks following a midfield-transition. For fast-attacks from deep, he ranked sixth for xG-contribution (0.12 per 90).
Thankfully, Mohamed Salah, the club's major acquisition so far, brings complementary qualities to the table and adds much-needed depth to the wide-forward ranks. James Yorke of this parish has already praised the signing earlier this summer and my only addition is that Salah showed up quite highly for xG-contribution (0.07 per 90, ranking eleventh in Serie A) for fast-paced attacks following a midfield-transition. The addition of Salah improves what was already a healthy front-line attack.
Defensive issues
According to the Objective Football website run by Benjamin Pugsley, Liverpool conceded just 8.1 non-penalty shots per game, ranking second over the past eight seasons behind a Pep-infused Manchester City last year. Shots-on-target conceded (3.0 per game) told a similar story, ranking joint-sixth over the same period. However, they combined these extraordinary shot-suppression numbers with the highest expected goals per shot in the league (0.11), which is the worst value I have over the past five seasons. When Liverpool conceded shots, they were of high quality, which ultimately saw them sit fifth in terms of expected goals against last season.
Klopp's tactical system does deserve credit for melding a highly exciting attack with strong defensive aspects in terms of shot-suppression. The optimistic take here is that tweaks and a greater familiarity with his counter-pressing tactics could bring about improvements in shot quality conceded, thereby seeing better defensive numbers. It's worth noting the period during November and December 2016m their expected goals against was the lowest it has been consistently over a 19-game span in the past five seasons, so the current squad is capable of sustained excellence in this realm.
The pursuit of Virgil van Dijk does suggest that the club are aiming to recruit a new starting centre-back. That saga remains running at the time of writing as the world waits to find out just how costly a single ice cream can be. Centre-back depth is an issue that does need to be rectified; that Lucas Leiva made six appearances as a centre-back last term is all the evidence needed here.
The other aspect of Liverpool's defense that could improve is in the goalkeeping stakes. From a pure shot-stopping perspective, Karius has the best pedigree; in my goalkeeper shot-stopping analysis, Karius came 31st across the data-set with a rating of 91%, which is a pretty decent indication that he is an above-average shot-stopper. Mignolet fared much worse with a ranking of just 25%, which places him at best as an average shot-stopper during his Liverpool career to date. I haven't looked at numbers for the Championship but Mark Taylor's numbers for Ward at Huddersfield were not encouraging. Playing Karius would be a bold move by Klopp given his limited exposure to English football thus far but Mignolet doesn't provide much confidence either -personally, I would go with Karius.
Title talk
If I've learnt anything while sifting through the data for this preview, it's that Manchester City should be strong favourites for the title this coming season.
Can Liverpool challenge them, while also competing in Europe? At present, I'd side with no given that the depth issues of last season have yet to be addressed and the remaining questions marks in terms of the defense.
Liverpool's other transfer saga involving Naby Keita could be a game-changer given that he could have a transformative impact on the team's midfield but the likelihood of him signing appears to be receding by the day. Midfield depth is also potentially an issue unless Klopp is happy to rely on youth to cover midfield absentees over the season.
With potentially five teams in the Champions League group stages, progress to the latter rounds could have a strong bearing on league form post-Christmas. Six into four is likely the maths heading into the new season and Liverpool should again be well in the mix.
Prediction: Third We're gonna win the league
On the anatomy of a counter-attack

One of the most enduring aspects of football is the multitude of tactical and stylistic approaches that can be employed to be successful. Context is king in analytics and football as a whole, so the ability to identify and quantify these approaches is crucial for both opposition scouting and player transfer profiles.
At the OptaPro Forum this year, I looked at data from the past five Premier League seasons and used a sprinkling of maths to categorise shots into different types. One such style I identified was 'fast attacks from deep', which were a distinct class of shots born of fast and direct possessions originating in the defensive zone. While these aren't entirely synonymous with counter-attacks, there is likely a lot of overlap; the classical counter-attack is likely a subset of the deep fast-attacks identified in the data.
These fast-attacks from deep typically offer good scoring chances, with above average shot conversion (10.7%) due to the better shot locations afforded to them. They made up approximately 23% of the shots in my analysis.
So what do they look like?
To provide an overview of the key features of these attacks, I've averaged them together to get a broad picture of their progression up the pitch. I've presented this below and included a look at attacks from deep that involve more build-up play for comparison.

Fast-attacks from deep are characterised by an initial speedy progression towards goal within a team's own half, followed by a steadier advance in the attacking half. This makes sense qualitatively as counter-attacks often see a quick transition in their early stages to properly establish the attacking opportunity. The attack can then be less frenetic as a team seeks to create the best opportunity possible from the situation. Over the past five seasons, the stand out teams as rated by shot volume and expected goals have been various incarnations of Arsenal, Manchester City, Chelsea and Liverpool.
The architects
Player-level metrics can be used to figure out who the crucial architects of a counter-attacking situation are. One method of examining this is how many yards a player's passing progressed the ball during deep fast-attacking possessions. Below I've listed the top 10 players from the 2016/17 season by this metric on a per 90 minute basis, alongside some other metrics for your delectation.
While the focus was often on him kicking people rather than the ball, we see that Granit Xhaka stands alone in terms of ball progression, with Daley Blind a long way behind him in second place. Xhaka's long-range passing skills are well known, so combining this with the most passes per 90 in such situations propels him to the top of pile.
The graphic below illustrates Xhaka's passing during deep fast-attacks, with his penchant for long passes spread all over the midfield zone evident. For comparison, I've included Eden Hazard's passing map as someone who played many important passes that were limited in terms of ball progression as they were typically shorter or lateral passes in the final third.
Evidently there is a link between position and ball progression, as players in deeper positions have greater scope to progress the ball as they have more grass in front of them. The likes of Coutinho, Özil and De Bruyne residing so high up the rankings is therefore impressive.

Coutinho's passing chalkboard above illustrates his keen eye for a pass from midfield areas through opposition defensive lines, as does De Bruyne's ability to find teammates inside the penalty area. De Bruyne's contribution actually ranks highest in terms of xG per 90 for the past season.
The finishers
While ball progression through the defensive and midfield zones is important for these fast-attacks from deep, they still require the finishing touches in the final third. There are fewer more frustrating sights in football than watching a counter-attack be botched in its final moments. The graphic below summarises the top players in this crucial aspect by examining their expected goal and assist outputs. Unsurprisingly, Kevin De Bruyne leads the way here and is powered by his exceptional creative passing.
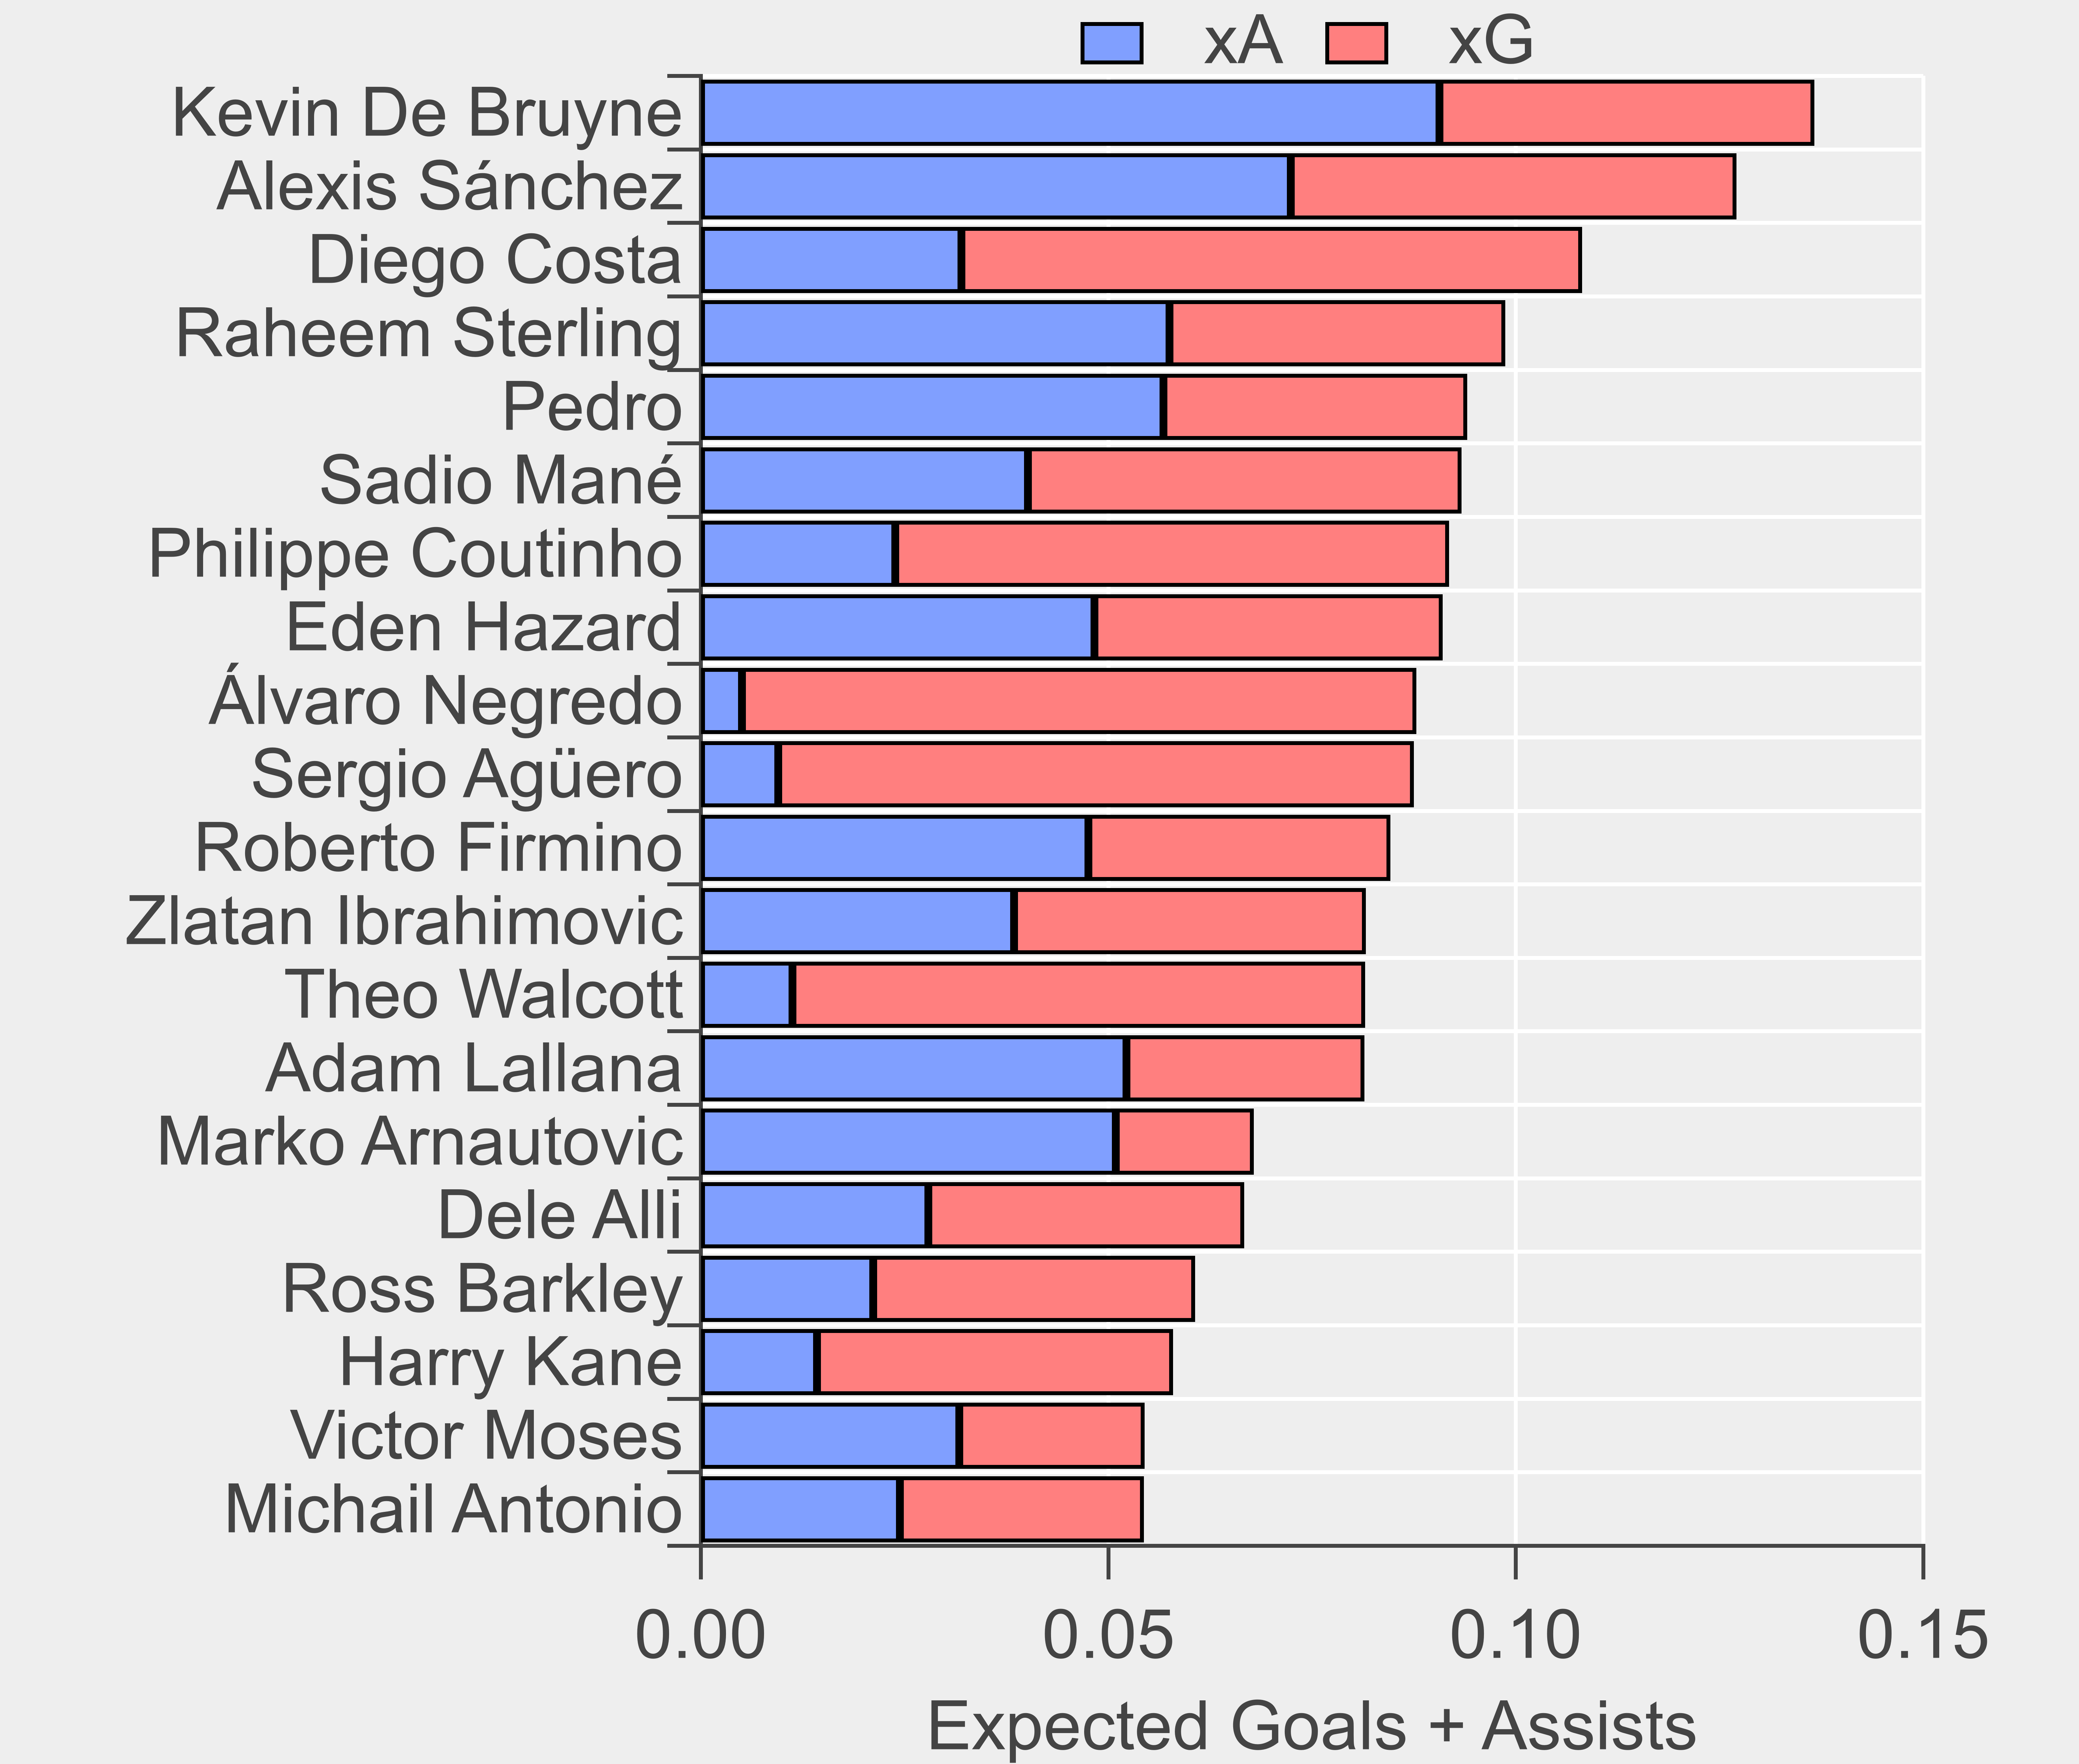
The list is dominated by players from the top-6 clubs, with Negredo the only interloper inside the top-10 ranking. Middlesbrough's minimal attacking output left few scraps of solace for Negredo but at least he did get a few shots away in these high-value situations to alleviate the boredom.
Conclusion
The investigation of tactical and stylistic approaches carried out above merely scratches the surface of possibilities for opposition scouting and player profiling. Being able to identify 'successful' attacking moves opens the door to examining 'failed' possessions, which would allow efficiency to be studied as well as defensive aspects. This is an area rich with promise that I'll examine in the future, along with other styles identified within the same framework.