Messi saves, Germany draws, Leary screws (Nate Silver, Day 11)

Nate Silver was almost above $750,000! All Iran had to do was hold on to the scoreless draw for four more minutes. Alas, Lionel Messi is very good at futbol. I wouldn't be too concerned about Argentina's overall level of play. Iran played very well, while Argentina had to be at least a little bit overconfident, having already defeated the second best team in their group. At this point Argentina wins the group with at least a draw vs. Nigeria. Nigeria would also be happy with a draw as that would ensure they advance even if Iran gets a win against Bosnia, but we'll get to that shortly.

Germany generally struggle in their second game at the World Cup. They've also had unusual issues against African sides. Still, they weren't expected to struggle against Ghana, but struggle they did, going into halftime stuck at nil-nil. Mario Gotze was able to put them ahead one-nil before Ghana rallied with goals from Andre Ayew and Asamoah Gyan. Germany decided that Gotze was done scoring for the day, and they replaced him with Miroslav Klose, who promptly scored the equalizer two minutes later. After that Germany had a few more scoring chances, but eventually had to settle for the draw. This means that they can't relax against a USA squad that might still need a point (or three) to advance.

Poor Peter O'Leary. One day you're a secondary school biology teacher. The next day you (and your assistants)  are the poster boys for officiating villainy at the World Cup. They called an absolutely awful offsides to take away a goal fro Bosnia-Herzegovina. Not only was the call obviously wrong, but it was late. Leary should have overruled his assistant and made the goal stand. There was also controversy with the Ghana goal as perhaps a foul could have been called on Nigeria during the play, but that is a judgement call and frankly I would have allowed play to continue. I would also red card players who writhe in pain on the ground who then miraculously recover, so perhaps my officiating sympathies lie with slightly more physical play than is healthy.  Bosnia had a few good scoring chances late, but Vincent Enyeama played superbly and kept the ball out of the net. If Nigeria can manage a draw against Argentina, they be on to the second round. I'll be very suspicious if said draw is a boring scoreless variety, but all is fair in love and international futbol.

Despite not getting the huge win with Iran, Nate Silver managed another strong day, finishing with $477,136. Next up:

Game 30: Russia +0.5 goals, 13.32%: Risking $63,555 to win$65,520

Game 31: South Korea +0.5 goals, 17.67%: Risking 73,080 to win $32,480

Game 32:  USA +0.5 goals, 35.56%: Risking $121,082 to win $153,269

The general trend seems to be that Nate likes underdogs and draws, discounting favorites that aren't from South America. Despite the fact there have been unusually few draws, this has been working out quite well for Nate so far. We'll see if it continues.

The big game of the day (for Nate and myself) is USA-Portugal. Despite the fact that USA has a win and Portugal is coming off of an embarrassing defeat, I'm not nearly as confident in America's chances as Nate is. In fact, I'd consider a draw to be a huge victory, as that would mean a draw vs. Germany would advance both squads, with Germany on top in the group. I'm getting ahead of myself, so let's just enjoy another great day of futbol in Brazil. 🙂

Sail full-Kelly, y'arr! Costa Rica passes the test (Nate Silver, Day 10)

Despite some dodgy officiating, Costa Rica was able to get the result they deserved against Italy. It helped that Mario Balotelli had English level finishing skills. After being denied what surely should have been a penalty kick (and possibly a red card), Costa Rica scored right before the end of the first half. They carried the play for most of the second half and are now into the next round, most likely as the group winner. Impressive. England has nothing to play for, as Uruguay will need to beat Italy to advance. If they fail to do so, Italy moves on. I wasn't surprised that France beat Switzerland. I was surprised they annihilated them. Oof! The loss puts Switzerland in a surprisingly awkward position. They are competing with Ecuador for the second slot in the group. Their goal differential is -2, while Ecuador is at 0. Their main advantage is they get to face Honduras, while Ecuador has to face France. France clinches the group with a draw, so if that game is tied late, France might not be as aggressive as you'd otherwise expect. Switzerland needs to defeat Honduras and hope Ecuador doesn't do the same to France. Speaking of Ecuador, they probably didn't deserve the win they got vs. Honduras. If not for some questionable officiating Honduras might have won, or at least drawn. As is, Honduras are now effectively eliminated. As discussed earlier, Ecuador needs to stay ahead of Switzerland. At this point I think I'd prefer they fail to do so, as I don't think they deserve to be on three points right now. Despite poor results in the other two games, Costa Rica's victory put Nate Silver at a new closing peak of $418,288. He stands to enter the stratosphere if Iran can put u a result against Argentina. Game 27: Iran +0.5 goals, 12.02%: Risking $50,278 to win $340,775 Game 28: Ghana +0.5 goals, 5.57%: Risking $20,498 to win $62,116 Game 29: Nigeria +0.5 goals, 10.23%: Risking $44,002 to win $47,011 (Updated) If I had a breakdown of the various permutations in the Argentina-Iran game, it's quite likely that Nate would have taken Iran +2.25 goals, but without that information, I can only give Nate Iran +0.5 or Iran outright. If Iran manages to draw Argentina, I will be very surprised, and Nate will be off to the races. Truth be told, I expect Nate to be 0-2 heading into the most interesting game of the day. Despite their draw vs. Iran, Nigeria are still a dangerous squad. Bosnia-Herzegovina needs a win after losing to Argentina. Today feels like a bit of a lull before the big games tomorrow: Russia vs. Belgium, USA vs. Portugal. It appears Nate will be backing the underdogs in both of those games, but I'll get to that tomorrow. Enjoy the (potential blowout) games today!

Gifolution: France's Mighty Mouse, Mattieu Valbuena

Standing all of 5'5" and with a nose that looks like he spent a career as a professional boxer, Valbuena makes for a fascinating footballer. He's been rumored to be headed to England for half a decade, but none of the Premier League teams ever pulled the trigger on a deal.

The radars for the last five years of his career are a fascinating set of questions, more than answers. What does he do well? Pass the ball, and set up teammates to score. Maybe with a bit of dribbling mixed in for good measure. Beyond that? Meh.

The other off thing is how much these seasons change. How was he used in 09-11 compared to 11-14? The last three years, his key pass numbers have been great, but the assist tallies haven't always followed suit. Is this the result of crappy striking talent around him? Do most of his key passes result from crosses? Is his work rate slowing down now that he's nearing 30, or does it just look different because of tactical changes?

Valbuena is a fascinating player, and certainly one that you'd spend a lot of time watching to try and answer all the questions his stats leave behind.


Valbuena-200914

Three Lions are coming home (Nate Silver, Day 9)

Another brutal result for English football. Before he finally put one home, here is what Wayne Rooney had accomplished vs. Uruguay: https://twitter.com/Squawka/status/479719239671357440 While England was able to equalize (mostly due to great work from Daniel Sturridge), their missed opportunities proved costly when Luis Suarez rocketed a ball directly at Joe Hart. Joe, being a reasonably bright young man, wisely moved out of the way, and England's fate was sealed. There was actually a bigger issue in the game than England's predictable failure. Alvaro Pereira got knocked out during the game. He was taken off the field, but once he felt he recovered, he overruled the doctor and came back into the game. That's insane! FIFA's concussion protocols are clearly lacking, as is the player education. Even the coach could have stopped it by substituting him out of the game. Just an utter disaster all around. Greece were always going to be comfortable playing for a scoreless draw, but it became necessary when their captain Kostas Katsouranis picked up a second yellow and was sent off. Japan had already been getting the better of it and dominated most of the play after. They missed a golden opportunity when Yoshito Okubo shot wide in the 68th minute. He had a tricky angle, but an open net and just duffed it. Greece may have had the best opportunity after that, but Giorgos Samaras wasn't able to put his header on net. Japan is now in real trouble. Greece can put themselves in good shape with a win over Ivory Coast, but that doesn't seem likely. Columbia carried most of the play versus Les Elephants. They missed a few good scoring opportunities early, but were able to take a two-nil lead before Ivory Coast rallied and made it 2-1. Columbia was able to hold on and clinched advancement into the next round. If Ivory Coast can defeat Greece, they'll advance as well, although a draw should put them through unless Japan demolishes Columbia. It was another good day for Nate Silver as he swept to raise his bankroll to $286,231. It would have been even higher if I had locked in his initial bets the night before the games instead of the morning of. I decided not to repeat that, and so Nate's current plays for today are a bit better than what he could get at current market prices: Game 24: Costa Rica +0.5 goals, 38.00%: Risking $108,768 to win $197,759 Game 25: Switzerland, 2.19%: Risking $3,886 to win $16,323 (Update: Stakes unchanged despite Costa Rica win as lines have moved). Game 26: Honduras +0.5 goals, 11.64%: Risking $55,103 to win $84,379 (Updated) Nate has done well backing teams from the Western hemisphere. Perhaps it's an edge the market isn't properly evaluating. Then again, perhaps one shouldn't read too much into 23 games of football with high variance wagering. Speaking of, I have commissioned a few artists to get their takes on full-Kelly wagering. Good art takes time, so you'll have to be patient (as will I). Will Costa Rica reward Nate's faith in them? Let's enjoy another day of great football at the World Cup.  

El rey ha muerto, ¡viva el rey! (Nate Silver, Day 8)

Perhaps they were taking their cue from King Juan Carlos, who abdicated the throne in favor of son, Felipe IV. Perhaps Chile just wanted it more:

"I hate hate hate the cliché but Chile just wanted it more. What's been effectively a home-field atmosphere perhaps helps too."

— Nate Silver (@NateSilver538) June 18, 2014

Perhaps XKCD was right all along: http://xkcd.com/904/

Whatever the case may be, Spain was outscored 7-1 over the course of two games, with the lone one being a penalty kick. That was as awful a performance as any defending champion has ever put up.  The king is dead. A new king is waiting to be crowned.

I don't mean to dismiss Chile who played very well. Chile was able to frustrate Spain, and was very effective at converting their early scoring opportunities. Now Chile will face the Netherlands with group supremacy on the line.

The Netherlands fought off a feisty group of Socceroos.  After falling behind one-nil, the Socceroos responded with a brilliant strike from Tim Cahill. They were able to take the lead in the second half with a penalty kick, but goals from RVP and Memphis Depay (from distance) put the Oranje ahead for good.

Croatia was already the better team, up 1-0 when Alex Song effectively ended Cameroon's World Cup with an idiotic red card. Croatia was able to take advantage, winning four-nil. They'll still need to beat Mexico to advance, unless Brazil somehow stumbles against Cameroon.

Despite Australia and Cameroon letting him down, Nate Silver had a good day due to Chile. He now stands at $191,134.

Game 21: Columbia, 10.6%: Risking $20,260 to win $21,476

Game 22: Uruguay +0.5 goals, 23.04%: Risking $48,985 to win $45,357 (Updated)

Game 23: Greece +0.5 goals, 15.68%: Risking $40,449 to win $28,264 (Updated, adjusted % due to line moves)

I was expecting Nate to bet bigger on Columbia and Greece, but the lines have shifted a bit towards those teams. I'm curious to see how the Columbia-Ivory Coast game is officiated. I'd like to see the players have some freedom to be physical. Uruguay England is effectively an elimination game. I'm curious why people think it is a good idea to back England in one of those (or any game really), but they do. I'm assuming Greece will stick to their usual game plan of trying to avoid allowing any goals, and if they happen to accidentally score one, great!

Day eight should be a pretty nice day of football, but it merely an appetizer compared to the glory of day nine when Nate and Costa Rica will team up to take on Italy. You've been warned. Ciao!

Is Santi Cazorla a Central Midfielder?

I was messing about with some historic Cazorla data, and as I noted on Twitter at the time, I've never seen a shape like Cazorla's Arsenal season in 2012-13, especially on the attacking midfielder/forward template. This got me to playing with the awesome radar tool that @SamiHernia is building, and I started looking at Cazorla's stats on the CM/DM radar template instead. Here are four seasons of Santi's output, with the AM radar on the LEFT and the CM radar on the RIGHT. Check this out and see what you think. (I had to crop these originals to stop the site breaking.) Santi-Cazorla-2011   Santi-Cazorla-2012 Santi-Cazorla-2013 Santi-Cazorla-2014 It has me wondering if Cazorla is actually better as a center mid, and if playing him there can extend his peak output. There's evidence to suggest that his defensive output is high enough when put in the right position, and he's perfectly capable there as a passer. Additionally, this should keep him from taking quite so many long, awkward shots. Positional maps in most Arsenal games I saw had Cazorla tucked so far inside that he looked mostly like a midfielder and not a winger anyway. I don't actually know the answer, by the way... it's just a question that struck me when looking at the two visualizations.

A Likely Futile Attempt To Get Someone, Somewhere, To Accept Basketball's Best Player Evaluation Metric

I know what you’re thinking: why did this guy decide to write about formulas and theory when the Spurs just completed their epic quest for redemption and revenge. This has nothing to do with Heat-Spurs; you want to read about Gregg Popovich’s monosyllabic zingers and the size of Dwyane Wade’s cheeks. Seriously, what has he got stashed in there? At this point, I wouldn’t have been that shocked if he produced an actual gun and shot Tony Parker in the knee if it would have helped the Heat get back into to series. I promise there will be plenty of time for all this and more. I’ll even throw you a nugget right now—unnamed sources inside the Heat locker room confirm that Chris Bosh is experiencing particularly heavy flow this month. They expect him to be ready for the 14-15 season opener, but he can’t provide another win guarantee. That’s not what this is about, but really, this actually is all about Heat-Spurs after all. Sure, everyone loves a cheap laugh about Delonte West and Lebron’s mom, but at the end of the day that won’t leave you any closer to understanding what’s happening on the hardwood, why the Spurs and Heat made it to the finals again (and again, and again, in the case of Miami) and why the Carmelo Anthonys and George Karls of the world remain perennially bewildered losers. Right. So where do wins come from? What are a basketball team’s objectives? At the highest level, these can be summed up as just three:

  1. Gaining and keeping possession of the ball.
  1. Maximizing the rate at which you turn possessions into points.
  1. Minimizing the rate at which the opponent turns possessions into points.

That’s it! If players’ primary goal is to win games, everything they do on the court should be with these three things in mind. (Analyzing what they should do if they want to maximize the size of their wallet is an interesting and relevant question that we will disregard for the time being). But ok, you knew that those things were important, kind of. But do you know how something as simple as taking a shot affects these three factors? Here’s a picture of a Dwyane Wade’s cheeks you can admire while you think about it. wade_cheeks

  1. Before the shot, your team (Team A) has possession. The value of this is determined by the answer to (2), which will be Team A’s points per possession. But after the shot, possession is uncertain. The shot has a certain probability of going in, fg%, in which case the other team (B) certainly gains possession. It also has a probability of missing, 1 – fg%, after which possession remains uncertain. Now Team A has a certain probability of grabbing the offensive board and retaining possession, ORRa / (ORRa + DRRb), and Team B has a probability of securing the defensive rebound and completing the defensive possession successfully, DRRb / (ORRa + DRRb). So the probability of team A retaining possession after the shot is given by (1 – fg%)*ORRa / (ORRa + DRRb) and the probability of Team B having possession after the shot plays out is just one minus the aforementioned monstrosity.

Ok, so the first part is self explanatory, of course the field goal % (as a function of player, shot     location, defenders, etc), is the probability that the shot will go in and the only other outcome is that it will miss so we can represent that as 1 – the field goal percentage. Offensive and defensive rebound rates (ORR, DRR), while possibly a new term, are just as simple. A team (or player’s) offensive rebound rate is the percentage of offensive rebounds it secures out of the total possible offensive rebounds it could have gotten. The defensive rebound rate is the exact same thing for defensive rebounds. However, we can’t just say that the probability of team A snagging the offensive board in this case is ORR_a and be done. In that case the probability of team B getting the defensive rebound would just be DRR_b. What if team A is the old Doc Rivers Celtics team (rip…just kidding, good riddance) that notoriously didn’t even try for offensive rebounds and team B is, say, the Bulls with the Noah and Gibson in. So then ORRa might be .05 and DRRb might be .85…so the other 10% of the time the arena gets blown up by an army of black homophobic gay terrorist Donald Sterlings. As exciting as that might be, simply dividing by the sum of the two provides new probabilities that actually do add up to 100% and represent the real probabilities of each team ending up with possession. And that was just #1. Whew (wipes forehead) .

  1. As alluded to earlier, how taking a shot relates to turning possessions into points is essentially embedded in (1). The shot has a certain probability of going in and corresponding probability of missing. That much is obvious, but those probabilities will vary widely depending on the player taking the shot, the location the shot is taken from, the defending player or players, and so on. For example, for wide open fast-break layups you might be looking at 95% makes compared to 50% on 18 ft jumpers by Kevin Durant or 15% on the same 18 ft jumper but now its JJ Barea defended by Lebron. Of course, the value of the made shots differ as well.
  1. Here we basically have the flip side of (2) as viewed by the defensive team. Team A taking the shot wants it to be that wide open fast-break layup while Team B wants to get into situations more like the third example above. There have been some takes on this from the view of the offensive team as well; Phil Jackson famously discouraged corner threes because he thought they led to his defense being in disarray, but this has been shown not to be the case. I can’t find the study again; sue me, but basically they found that teams’ defensive efficiency after missed corner threes was significantly similar to their overall defensive efficiency. In fact, a good rule of thumb is that the corner 3 (along with layups) are the two best shots in basketball for trying to maximize (2).

This is just one small action; over the course of a game there may be 115 shots not to mention fouls, passes, steals and many other actions. For any of these actions, though, by examining how it affects each of the three big objectives we can see how the action helps or hurts a team’s chances of winning the game. With statistically derived values of points and possessions relative to wins, this allows us to find, in turn, the value of any box score statistic relative to wins. Wins Produced (wp, wins per 48, wp/48) is designed with this in mind, wrapping up all of a player’s box score statistics into one metric that measures how well a player achieves these three objectives, and thusly how much he helps his team win. Now let me be clear, as clueless basketball fan Barry O. from Hawaii would say, the thought exercise above gives us only the intuition behind the formula. The details of the statistical derivation can be found here, but essentially, what the possibly murky math does is conduct that type of analysis for every event that took place on the court within the given time frame. The reason to bother with all this is that wins produced is empirically validated to explain actual wins in actual NBA games where people actually said “We got the W and that’s what counts” or maybe the classic “both teams played hard”Between the 1977-78 and 2011-12 seasons, there have only been 2 seasons in which the correlation between Wins Produced (sum of minutes weighted wins per 48 of players on a team) and actual wins has been less than 90%. Unfortunately, not many people grasp the implications of this concept. Maybe it hasn’t been explained in a relatable way, which is why I’m making an effort to do so, albeit one that is likely futile. To this end, I will address the popular critiques of Wins Produced which come in three primary categories. The first camp agrees that wins produced is the best metric to capture a player and team’s productivity and simply suggests small tweaks in the way some detail is handled, such as how much to deduct from a scoring player and award to an assisting player when a basket was assisted or how to account for the fact that players take away their teammates rebounds. While these details are interesting to me I will disregard this camp for now as these people agree that wins produced is better than other metrics which don’t even account for these things at all. The other big WP critique comes in the form of “I can’t buy a metric that says player X is better than player Y.” Of course, this is never followed up with a deeper look into what parts of those players’ games correspond with the numbers that result in player x producing more wins, or anything rational like that. Instead, it has three subgroups itself: they either cite conventional statistics without bothering to consider quantitatively their impact on wins, or they cite the so-called experts that cite these conventional statistics on TV or in print, or worst of all, they don’t back it up at all; their point should be self-evident since it is the conventional wisdom in the first place. I dream of a day when we will be able to disregard these critics as well, but alas that day isn’t here yet. For those who cite alternate box-score stats like OMG PPG or the ‘experts’ who do, I would counter with an examination of how that metric relates to wins and explains them worse than WP. If they still “don’t buy it”, which is much more likely than not, or are in the third group, then this shows they are simply not interested in a metric that tells you about what players are contributing towards their team winning the game. Rather, they are looking for a metric to confirm what they already thought they knew. So then I would go on to discuss the point of doing research in the first place: finding the objective unbiased answer to a question. If that question is how much value does each player contribute to his team, where value is defined as on court actions that lead to wins, then if the best answer to that question is different to what we expected we don’t go back and change the question to get the answer to meet our expectations. Sadly, this occurs all too often, even at the highest levels of academia, but not here, damnit! This aggression will not stand!  This doesn’t mean that player evaluation based on WP has no similarities to conventional wisdom. Lebron, Durant, and CP3 are still the best players. Kevin Love, Steph Curry, and James Harden are still clear-cut all-stars, to name a few. But when I tell you that Brandan Wright had the 8th best 2013-14 season on a per-minute basis or that Trevor Ariza ‘produced’ 13.3 wins for the wizards this year, 11th most in the league, my hope is that maybe, instead of automatically discounting the possibility that these guys had excellent seasons because Mike Wilbon, Reggie Miller, and the like didn’t say so you might look a little deeper into why WP ‘likes them’ and what traits they have that their more-hyped less productive counterparts lack. The final main critique is regarding what WP doesn’t take into account. These critics mention everything from issues off the court to player health to “intangibles” such as leadership. The first thing I would tell one of these critics is that I agree that each of these factors is important and should be accounted for when determining a player’s worth. But why are these factors important? When a player plays drunk or through an injury, that player’s team being more likely to lose is more than one step down on the causal chain. The issue causes the player to play worse, which in turn causes his team to be more likely to lose. The effects of these issues are in fact manifested in the wins produced output via their effect on that player’s actions on the court. Unfortunately, this alone doesn’t allow us to quantify these effects precisely, which would certainly be valuable. However, they are not unaccounted for in WP, or, by the same logic, any other metric. None of this is to say that WP is a perfect metric. As the first type of critique implies, there is debate among which version of WP is best. At best, all but one of them is wrong; more likely, none is precisely correct when we’re talking about picking how to weight factors that can’t be measured directly out of a continuous distribution of possibilities. The correlation with wins is very high, but not 100%. The difference tends to be attributed to parts of team defense that isn’t measured (team defense is incorporated in the formula, though), but this is only a logical hypothesis. Furthermore, we don’t really have any data on teams constructed with only WP in mind. In order to give an example, it is necessary to show some concrete examples of players’ win produced numbers. I was going to do that eventually anyway, so this is as good a time as ever. Wins produced is normalized such that the average WP per 48 is .1 at each position. Some players that had average seasons in 2013-14 include JJ Hickson (.099), John Henson (.099), Kyle Singler (.1), and, more surprisingly to mainstream fans, Al Jefferson (.1), and Luol Deng (.101). When multiplied by their minutes played and divided by 48, these players produced 3.8, 3.8, 4.8, 5.3, and 4.6 wins respectively. To give you an idea of the high end of the range, among players who played 500 or more minutes, Chris Paul led the league on a per-minute basis the last 2 seasons with WP per 48 of .348 and .335. In terms of total wins produced, Durant and Lebron have led the league the past 2 seasons with 20.1 and 19.7 this year and 20.6 and 20 in 2012-13. If you want to look up someone in particular or just see them all, go here. In between the very best players and the average ones, some notable examples are Tim Duncan (.201), Serge Ibaka (.2), Dwyane Wade(.193), Lance Stephenson (.215), and, more surprisingly, James Johnson (.216), Terrence Jones (.203), and Kyle Korver (.2). On the low end, we have Al Harrington (-.146), John Lucas III (-.137), and the first pick of the draft (link) (-.126), and Dwyane Wade’s cheeks (-.125). So yes, you can contribute negative wins to your team, as mistakes like missed shots and turnovers are penalized. Just ask Andrea Bargnani, who had one of the best years of his career posting -.049 WP per 48. Obviously a team can’t win less than 0 games, but just we don’t have data on the extreme end of low WP for this to become an issue. As much as I’d like to see a lineup of Harrington, Lucas, Bennett, Bargs, and Wade’s Cheeks and as stupid as most NBA general managers are I don’t think they’ll ever be quite stupid enough for us to get this treat. But maybe someday they’ll be smart enough that we get to see the other end of this. If we do, though, we aren’t going to see a team with a rotation full of Lebrons and KDs, even in the era of Big 3s, who may or may not actually be the best 3 players on their team. Instead, it would be a team full of guys that are underrated by conventional statistics but not WP. These are players who don’t have high raw PPG numbers but, whatever they do contribute on offense, they contribute efficiently and good defenders. Indeed, PPG correlates strongly with salary but getting those points efficiently does not. So imagine the following lineup made up of players that would be very easy to acquire. Position             Player                                                 13-14 WP / 48 C                        Chris Anderson                                  .279 PF                      Jeff Adrien                                          .244 SF                      Trevor Ariza                                        .234 PG                     Pablo Prigioni                                     .216 SG                     Danny Green                                       .188 How would this team fare against: C                        Demarcus Cousins                             .157 PF                      Blake Griffin                                       .169 SF                      Carmelo Anthony                              .161 SG                     Demar Derozan                                  .096 PG                     Russell Westbrook                             .163 I’m the guy writing to advocate this metric and it’s still pretty hard to pick the former. In this case, I think my thought process is similar to what anyone else’s would be: the WP All Stars would never score! Even against the mediocre defense of the Yay Points All-Stars, the WPAS will be unable to create the high percentage opportunities that they are accustomed to. The WPAS wouldn’t give the YPAS open looks, but the YPAS are used to jacking up low percentage and some of them will go in. Probably more than those of the WPAS. But the YPAS could never be a real team due to salary considerations. Let’s replace a few of the players and give us the following theoretical but possible team: C                        Jonas Valanciunas                             .139 PF                      Tyler Zeller                                          .125 SF                      Carmelo Anthony                               .161 SG                     Demar Derozan                                   .096 PG                     Russell Westbrook                             .163 Now this team is more realistic. I don’t think it’d be all that great in the real NBA—the Thunder as currently constructed are pretty much a strictly better version and while they are very good, they’ve only made one finals and that was with James Harden as well. Yet I think I’d still have to take these five against the WPAS. Maybe I’m wrong. Maybe I’m letting myself be blinded by convention the same way I might say someone is who claims Melo is better than, say, Nic Batum or Andre Iguodala. But right now, I truly believe that it’s true just like those “idiots.” And if that first listed team wouldn’t beat the last, clearly WP isn’t the end all be all statistic and some balance amongst actual basketball functions must be sought as well. Wins Produced is just the start of the analysis; of course we must dig deeper to see how different players are producing wins and group them coherently so that the team can actually perform the basketball functions it needs to. But it’s the best starting point we have right now. So while I don’t want my Bulls to go out and build the example WPAS team just yet, I also don’t want them to trade all their assets for one of about equal value as any one of them in Carmelo Anthony either. I promise I don’t mean to target you, Melo, you’re just a good example of being overrated and cut down to size by a little math wisdom. If Kobe hadn’t been injured all season it’d be him instead. So back to the Bulls, I’m not saying to ditch Derrick Rose for Pablo Prigioni even if Rose comes back to his old, solid but overrated form (.161 WP per 48 in 2010-11, his MVP season). I’m just saying to think a little bit before you think you can replace Kyle Korver with Marco Belinelli and then Mike Dunleavey just because they’re all white and you can save some salary. And to give Ronnie Brewer some minutes once in his life! And so on. Oh and about those Spurs? Wins produced thinks they had some pretty good players this year. Kawhi Leonard            .294             (6th in the league) Tim Duncan                 .201 Danny Green                .188 Manu Ginobili              .184 Tiago Splitter                .158 Patty Mills                     .157              (71st) These rankings might not seem so impressive to at first, as only the well deserving finals MVP truly shines, but as we know the Spurs do it as a team. And having ¾ of your entire rotation in the top 16% of the league is actually pretty impressive to me when I look at it that way. WP also thinks some guys weren’t as important as we think.... Tony Parker                  .085 (he did put up a much better .18 in 12-13, though) Boris Diaw                    .093 (have to admit, doesn’t seem to do justice to his finals contribution) Of course, there’s much more to why the spurs won the title than simply listing their players and performance, but that will have to wait for another time.

Fear and Loathing in Brazil (Nate Silver, Day 7)

No sympathy for the devil; keep that in mind. Buy the ticket, take the ride...and if it occasionally gets a little heavier than what you had in mind, well...maybe chalk it off to forced conscious expansion: Tune in, freak out, get beaten.

Hunter S. Thompson, Fear and Loathing in Las Vegas

Things were looking so good for our protagonist. One half in the books, Algeria up one-nil, and Belgium looking disorganized. After that, things turned dark. Belgium's substitutions proved fruitful and they rallied as Algeria wilted. However the real disaster was yet to unfold: First, check out this heat map of shots:


brazil_mex

Now, check out Saint Guillermo "Hands" Ochoa:


ochoa


Mexico was never particularly threatening, but Brazil couldn't break through. Brazil will need to play significantly better if they want to win multiple games in the knockout stage. The only bright spot for our fearless hero was due to an absolutely miserable gaffe by the Russian keeper. Russia was able to rally for the equalizer, and carried most of the play afterward, but was never able to get ahead of South Korea.

After a tough day Nate Silver is still in the black at $168,759. Whether he can say the same tomorrow is unknown:

Game 18: Australia +0.5 goals, 10.21%: Risking $17,230 to win $74,914

Game 19: Chile +0.5 goals, 43.82%: Risking $66,400 to win $112,542

Game 20: Cameroon +0.5 goals, 27.62%: Risking $72,936 to win $117,639 (Updated) An 0-3 day would put Nate down to $61,616.

A 3-0 day would leave him up $613,827. Aye, when you sail full Kelly, the waves be steep! The biggest game of the day is Chile-Spain. Nate's model has Chile slightly more likely to be the victor. The betting markets expect Spain to win outright over 60% of the time. I'm curious how Spain will react after being demolished. Given the state of their tiebreaks, they need three points today. Croatia needs three points as well, although it is possible for them to draw and advance over Mexico on tiebreaks, but they'd need to demolish Mexico, winning by two or more goals. Given that Ochoa hasn't allowed a goal in two games, that's a tough task. Even with a win over Cameroon, Croatia will need to defeat Mexico, but at that point a one-nil result would be enough to advance.

I hope y'all are enjoying the games as much as I am. Let's get ready for another great day of futbol. As for Nate, well, Hunter S. Thompson said it best.

“We'd be fools not to ride this strange torpedo all the way out to the end."

Enjoy day seven!

The importance of Attacking Speed and the quickest attacking team in EPL

In my end of season Liverpool review I used some stats that showed Liverpool hadn’t actually taken any more shots from Fast Breaks than they had in the previous season. No doubt, anyone that watched much of Liverpool would point to the lightning fast breaks that Sturridge, Sterling and Suarez seemed to mount on a regular basis.

It is for this reason that I qualified the assertion that they didn’t create more Fast Break chances in this past season by saying that this conclusion was based on the Opta definition of Fast Break. I don’t think Opta publish their definition of Fast Break, so it is conceivable that their definition of a Fast Break is quite narrow, and so many of Liverpool’s attacks, whilst fast, may not have tripped the Opta Fast Break qualifier.

I did say in the Liverpool review article that I would like to take another look at this subject and as StatsBomb now has access to several seasons of Opta's most detailed on the ball data I’m now in a position to look beyond just the Opta definition of Fast Break, and perform some advanced analysis on the speed that teams attacked with.

  Does Speed of Attack matter?

It certainly seems intuitive that having fast attacks should be a great way to launch efficient attacking moves. The attacking team has the chance to drive forward against an opposition that doesn’t have time to set itself or possibly has gaps in its otherwise well drilled defensive shape. Contrast that with a slow, laboured approach and the barriers that such pedestrian attacks must overcome to score. Of course the highly technical teams, such as Barcelona in their tika taka prime, have players that can retain possession long enough to eventually force the opposition to make a mistake. But this tends not to be the attacking type of choice for most of the world’s football teams.

So, although faster attacking moves would seem to be a more efficient way of scoring than slower moves let’s first establish some baseline numbers.

I have set out detailed methodology at the bottom of this article for the techniques that I used, but in summary I generated a metric for speed of attack (in metres per second, or m/s) for every shot in the Barclays Premier League over the last 4 seasons (from 10/11 to 13/14).

To start off, I simply sorted the data set by the Speed of Attack and divided the data into two groups at the median Speed of Attack value (2.684m/s) – this gave me two groups with an equal number of shots in each.

SpeedGroups

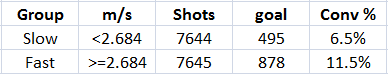
In this case, it is reassuring to see that the numbers back up the widely held assumption that attacking with speed and purpose is much more likely to lead to a goal than the shots that result from very slow attacks. Due to the large sample sizes the difference in conversion rates between the two groups are significant from a statistical point of view, with a p-value of <0.00001. Thus, we can confidently conclude that there is an advantage in having shots from fast attacks in comparison to slow attacking moves. Ok, so that’s not ground breaking but we needed to stick some foundation pegs in the ground.

  Deciles

If we divide the data sample into more groups does the relationship of faster attacks equalling higher conversion rates still hold?

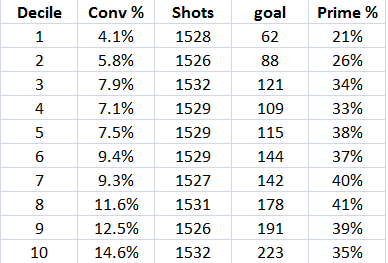
To answer this question I divided the data set into deciles, with each decile containing just over 1,500 shots. The summary information for each decile can be seen in the table below:

Deciles

…and in graph format we can see the very strong correlation with the shot conversion rate increasing almost in line with the step up in decile number.

DecileChart

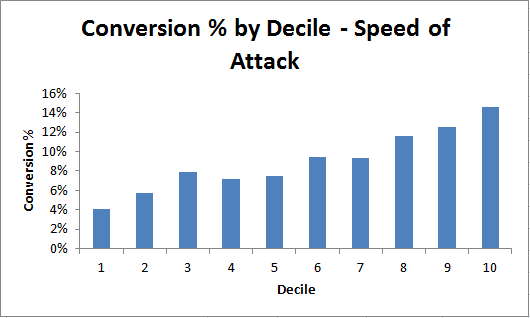
I appreciate that I have only plotted 10 data points in this chart but we can see that there is a very good, uniform correlation between the speed of the attack and the conversion rate of the shots coming from those attacks.

  Shot Location vs Speed of Attack

I think it’s worth looking at some of the above figures in detail; specifically how the conversion rate changes depending on the decile of Speed of Attack and how that in turn relates to shot location.

Locations

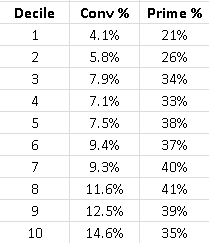
This table plots the conversion rate for shots for each decile as well as the proportion of shots that were taken from the area that I term as the Prime Zone, ie the central portion of the penalty area.

At this stage, I imagine that everyone is aware that shot location should be taken into account when evaluating how the raw shot numbers translate into shot quality. However, the above table is super important as it seems to suggest that the Speed of Attack may actually be even more important than the location of the shot.

It can be seen that the two groups with the fastest attacks (Deciles 9 and 10) had the best conversion rates. Groups 7 and 8 had a higher proportion of shots in the Prime Zone yet had a slightly lower conversion rate than 9 and 10.

Generally, the shot location correlates well with the Speed of Attack, in that the very slowest attacks also tended to have the shots from the worst locations. This will be partly due to the fact that the slow, or even backwards in some cases, attacks will have allowed the defence to get set and force the attacking team to shoot from bad locations. Possibly a little out of necessity and a little out of sheer frustration.

However, the key takeaway here is that the swiftest attacks can overcome any potential advantage that working the ball into the best locations might bring. Of course, in many instances these two aspects will be intertwined as it will be easier to get into Prime locations from faster attacks than it is from slower attacks.

In Speed of Attack we have a metric that rivals, and perhaps even bests, shot location in terms of its impact on a shot resulting in a goal.

  2013 Premier League

As well as calculating the speed of each attack I’ve also been able to count the number of touches (attacking events) that Opta assigned to each attacking move prior to the shot. This information can be used to provide an objective measure of how direct each team’s attacks were on average last season.

Directness of Attack This table includes the shots from my filtered down data set (see the Methodology piece at the bottom of this article), but in summary it includes any attacking moves that started in open play and seen at least 2 attacking events occur before the shot.  It shows the average touches that each team took in their attacking moves prior to the shot.

Directness

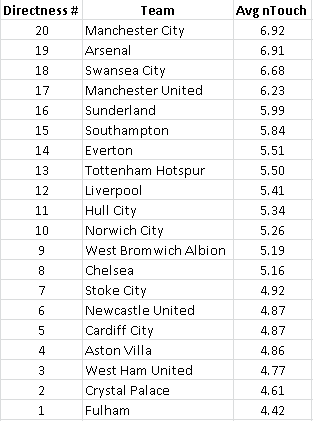
It’s always comforting when a list of numbers that is calculated in a scientific method passes the eye test, and this table has achieved that. The teams at the zenith of this table are certainly the teams that are happiest when in control of the ball; Man City, Arsenal and Southampton.

  Sunderland

It may be surprising to see Sunderland appear so highly up the average number of touches table, as in general, weaker teams tend to play a more direct style of football. However, Sunderland’s rank should come as no surprise to those who know their manager Gus Poyet. In fact, last November he pleaded for patience from their fans as he said:

I want the team to learn to be calmer, to pass the ball better. It is going to take time to get this way of football going but trust me, the fans will like it in the end.

Not only was Poyet successful in keeping the Black Cats in the Premier League this season, but he also succeeded in changing the way that his team played. Sunderland’s average touches per shot of 5.99 this season compares very favourably with the figures of 4.30, 4.46 and 4.53 recorded respectively in each of the three previous seasons. As can be seen from the above table, the jump from an average of 4.4 touches per shot to 6 is substantial and requires an entirely different playing style. Poyet deserves a large amount of credit for successfully pulling off such a transformation.

  Most Direct Teams

At the other end of the table we see the very direct teams. This group includes Fulham, Crystal Palace, West Ham and Aston Villa; none of whom seem out of place in these positions. On the other hand, Chelsea’s place in this table sticks out with them being the 8th most direct team, yet they are undoubtedly one of the three best teams in the league. The Blues differ from the other top teams as they are extremely comfortable without the ball and are happy to sit back, soak up pressure and hit teams on the counter attack.

All in all, the simple measure of the average number of attacking events prior to each shot seems to objectively encapsulate the various playing styles of each of the teams in the Premier League.

  Speed of Attack

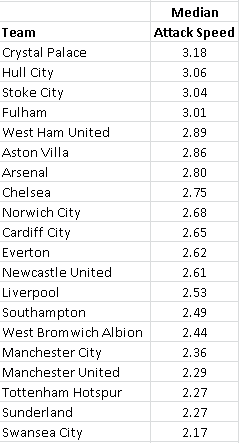
Don't worry, I haven't forgotten that this article is supposed to be about the speed that teams attack with. To keep things simple to start, I calculated the median Speed of Attack for each team (in m/s).

Median

However, using this method causes a problem which can clearly be seen when I plot the average touches per attacking move with the median Speed of Attack.

plot

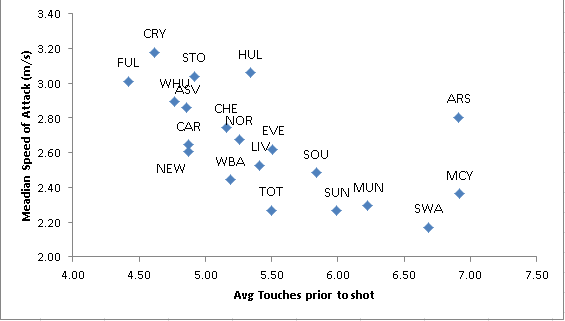
Apart from a few noticeable exceptions, namely Hull, Man City and Arsenal we can see that there is a very strong correlation between the two measures. This is entirely understandable as effectively we are plotting the average Speed of Attack against the average number of touches in the attack and thus we would expect a strong negative correlation, which can be clearly seen. It is apparent that we need a slightly different measure.

Although it is interesting to see the average (or median to be correct) Speed of Attack of each team, this metric isn’t what I set out to investigate as the median number will be compressed due to its nature. It is entirely feasible that a team (such as Liverpool) could have an average attacking speed of x m/s, but a chunk of their attacks are substantially faster than that. It is the ability of a team being able to mount fast attacks that I set out to measure.

The method I finally settled on was to look at the Speed of Attack for each team’s 95th and 90th percentile for Speed of Attack. I used a percentile basis instead of simply looking at the speed of the (for example) 10th or 25th fastest attack for each team as the teams that took relatively few shots would be at a disadvantage. The teams that took more shots would be expected to have a greater diversity in their Speed of Attacks, ie more very fast and very slow attacks.

95th Percentile

The following table shows the attacking speed of each team’s 95th percentile, ie each team had 95% of their attacks slower than their respective values in this table:

95

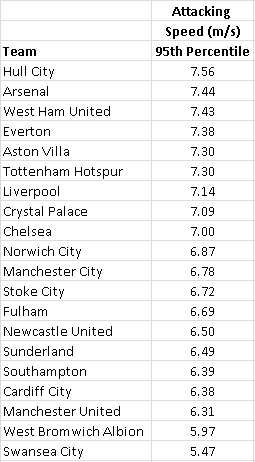
It will probably surprise most readers of this article to learn that, when looking at the speed of the fastest 5% of each teams’ attacks, Hull City emerged as the Premier League team that had the fastest attacks. It’s important to note that The Tigers haven’t got to that position just by playing long balls, unlike say, West Ham who also appear towards the top of the table. In the table I included above we observed that Hull were in the middle of the pack in terms of how directly they tended to play.

Although we have seen that Arsenal take a lot of touches per attacking move, it is clear that they can occasionally launch very quick attacks, as the speed of their 95th percentile attacking move is almost 7.5m/s.

Needless to say, I am somewhat surprised to see Liverpool only appear in 7th place on this measure.

At the foot of the table, it appears that Swansea take their passing methodology and desire to retain the ball to an extreme. The pace of their 95th percentile attack is decidedly pedestrian (remember 95% of their shots are from attacks that are slower than this value) when compared to the other Premier League teams. I would suggest that the ability to mix up their tactics and introduce some pace, a la Arsenal, should be high on Gary Monk’s “To Do List” next season.

The above table provides yet another reason why Man United struggled under David Moyes last season. His team simply seemed incapable of attacking with pace.

90th Percentile

In this next table I looked at the speed of the 90th percentile attack of each team, ie 90% of each team’s attacks were slower than this rate:

90

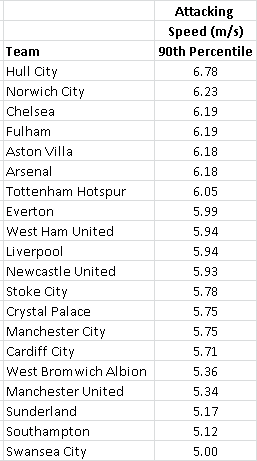
As with the 95th percentile table, Hull had the fastest attacks on this measure – this shows that they didn’t just have a very few fast attacks, but were able to maintain a fast attacking tempo fairly consistently. In doing this, they achieved what Arsenal was unable to do, as the Gunners slid down this table compared to the 95th percentile one.

We can see the teams that tend to play in a more direct fashion rise up this table. This is to be expected as we move towards the median speed of attack that we observed earlier in this article.

Liverpool

Once again, Liverpool is ranked right in the middle of the table. Despite what our memories and recall told us about Liverpool’s attacks last season, it does indeed look like I arrive at the same conclusion as I did in my end of season review. It appears that The Reds were not attacking faster than they were the previous season. The number of Fast Breaks as defined by Opta suggested this, and after looking at the speed of each individual attack I am not finding any evidence to contradict this assertion. I would guess that the terrific success rate that Liverpool enjoyed on their Fast Breaks this season, where they converted 33% of such attacks, has meant that subconsciously we remembered a lot more of their fast attacks than we did for other teams.

  Hull

When I first planned the mechanics behind this article I had assumed that I would have seen Liverpool posting the fastest attacks. However, this was certainly not the case. Instead I was very surprised to see that Hull claimed this accolade, and as stated above, these quick attacking movement numbers don’t seem to have been earned by them playing a very direct style. I’m sure that their numbers are flattered by the fact that they didn’t see very much of the ball or didn’t have a huge number of shots. According to Whoscored, only 5 teams had less possession of the ball than Hull and only 3 teams shot less than they did.

This meant that the environment existed for them to launch fast attacks. However, other teams that ceded possession should also have been in a position to do this, but Hull managed to do it better than everyone else.

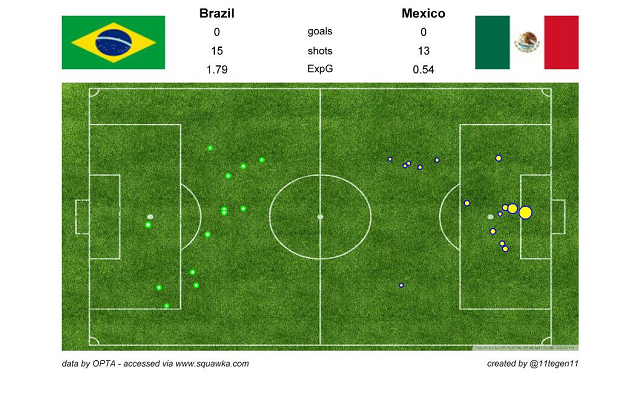
I would contend that Hull were arguably unlucky with the outcomes of their fast attacks. They failed to score with their 12 fastest attacks (measure in m/s), and their 13th fastest attack resulted in a goal scored by Jake Livermore which can be seen below. I even think I can offer a suggestion as to why The Tigers drew a blank with the shots that came from their 12 fastest attacks this season – 8 of them fell to either Shane Long or Nikica Jelavic.

Perhaps they need Jake Livermore on the end of a few more of them…… Fast forward to 3:11 in this video to see the perfectly exectuted fast attack. [youtube id="kB0z-30FRfQ" width="633" height="356"]

Speed of Attack Methodology

For each shot, I worked backwards until I reached the start of the possession chain, and I noted the x co-ordinate of the start of the attacking move, the x co-ordinate of the shot position and the time that elapsed between those two events. I was only interested in the speed of the vertical movement of the attack, so I ignored the y co-ordinates for this exercise.

I calculated the vertical distance in metres of the attack with the formula {(shot x – move_start x)*1.05} and then divided that distance by the duration of the attack (in seconds) to give me a metres/second (or m/s) value for each attack.

At this point I should mention that where a shot was the first action of an attacking team in the move, ie from a free kick, a penalty, or scoring directly from an opposition touch that such a shot would not be assigned a speed of attack. Shots from these events were excluded in this study.

It would be unfair to compare attacks from open play with those that originated from a set piece or a goal kick as the latter attacks would generally face a solidly set defence. To combat this I am only looking at attacks where the first event in the move was not one of: goal kick, free kick, throw in or corner kick.

Own Goals were excluded from the data set.

I added two more filters to that data set that could be construed as objective, but I am happy with the rationale for my inclusion of them. The first of these is that I excluded any shots where the move began from a location with an Opta x co-ordinate of less than 17, ie inside the teams’ own 18 yard line. I introduced this to reduce the chances of a goalkeeper kicking a long clearance to his striker who has a shot. I’ve no doubt that such a move would have an exceptionally fast Speed of Attack number, but this tactic isn’t what I’m trying to analyse here.

The final filter that I applied is that an attacking move had to have at least two Opta attacking events before the shot was taken, ie at least two passes or a successful take on and a pass. In reviewing tape of attacks that had just one event preceding the shot many of them came from a defensive header from inside the box or other instances where the defence didn’t really have full control of the ball. The clearances were passed back into the box and a shot was taken. As the attacking sequence was very short, at just a couple of seconds, these attacks registered a very fast m/s value. Once again, this type of attack isn’t what this analysis is about and so I didn’t want the outcomes of these attacks (be they good or bad) contaminating the data set which will mainly contain longer attacking moves.

All the above resulted in a final data set of 15,289 shots, out of more than 40,000 total shots across these four seasons.

I am aware that there could be some debate about which attacking moves to include in the study. It is extremely difficult to come up with water tight logic that will see that the study only includes “proper” attacking moves. As soon as the defence touches the ball I am working on the basis that the original attacking move has ended and a new one begins; even if it is the case that the defence only had a brief touch and didn’t have the ball under control. Of course, I can see how this isn’t ideal but we need to draw the line somewhere in terms of objectively deciding when one move stops and another one starts.

Despite that, I don’t feel that changing the data rules about which attacks ended up in the final data set would materially change any of the conclusions reached in the data. I’m merely acknowledging that there is no right or wrong answer in terms of how to piece together attacking moves, even from the detailed Opta data files.

Gifolution: The Majesty of Xavi Hernandez

I've never seen a set of radars like this, and honestly, we might never see them again. All of these seasons are good. 2009-10 and 2011-12 are legendary, and regardless of how many years of data we look at, will almost surely rank as some of the best midfielder seasons ever.

Xavi is and always will be one of the game's greatest passers. This is completely obvious if you have seen him play at Barcelona over the last decade. The statistics can't help but to agree.

Xavi_0914